EXCEL
This is a spreadsheet software developed by Microsoft used to insert , read and manipulate data.
This is an example of how an excel page looks like. It is called a workbook
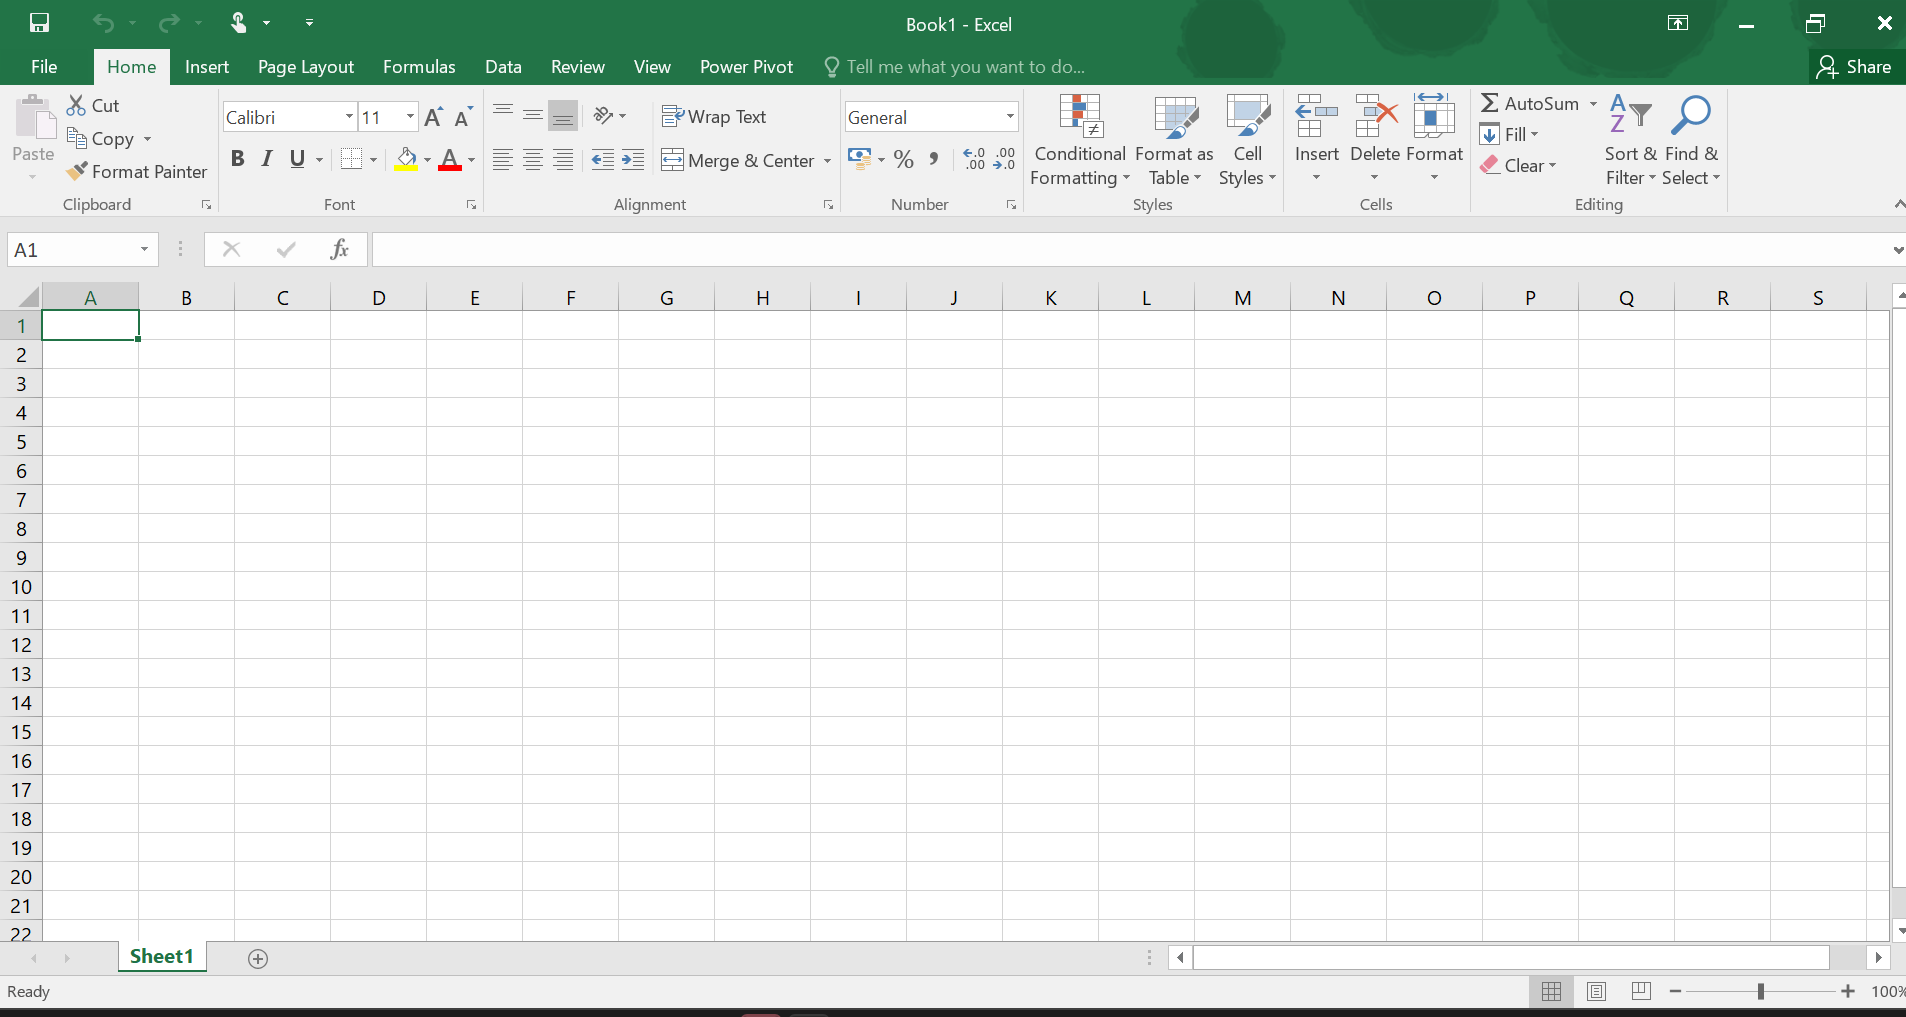
Basics of excel
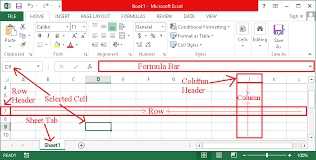
Formula bar - Area above the grid where the contents or formula of the selected cell appear.
Column header - Is the label at the very top of a column in a spreadsheet, database, or web table.
Row header - Is the first column in a data table that identifies the specific information, category, or ID for the corresponding data to its right.
Selected cell/Active Cell - Is the currently selected cell in a spreadsheet where you can directly enter data or formulas.
Sheet tab - Tabs at the bottom (Sheet1, Sheet2) that switch between spreadsheets within a workbook.
Cell - A single box where a row and a column intersect eg D9.
Row - Labelled 1,2,3... down the left side horizontally .
Columns - Labelled A,B,C... across the top vertically.
Ways in which Excel is used in real world data analytics
1. Financial reporting
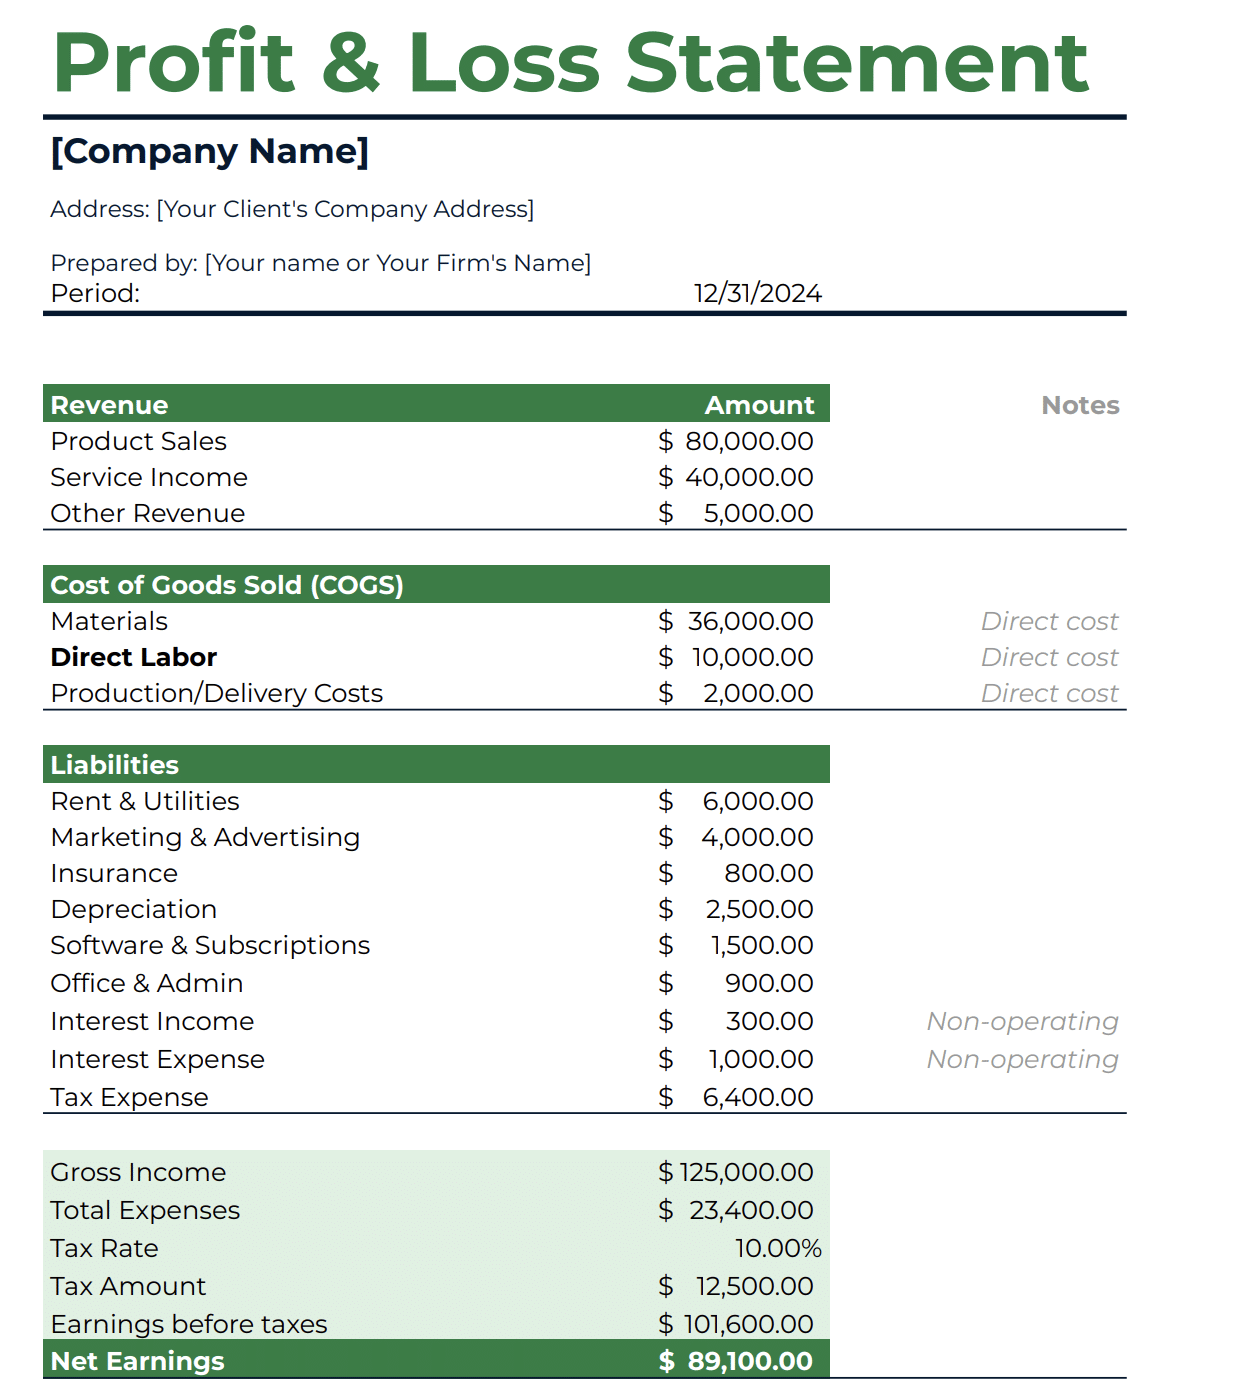
Most business uses excel to create financial reports, forecast revenue and analyze profitability. Excel can also help track expenses , manage cash flow and optimize financial decision making.
This is an example of a profit and loss statement
2. Healthcare & Research
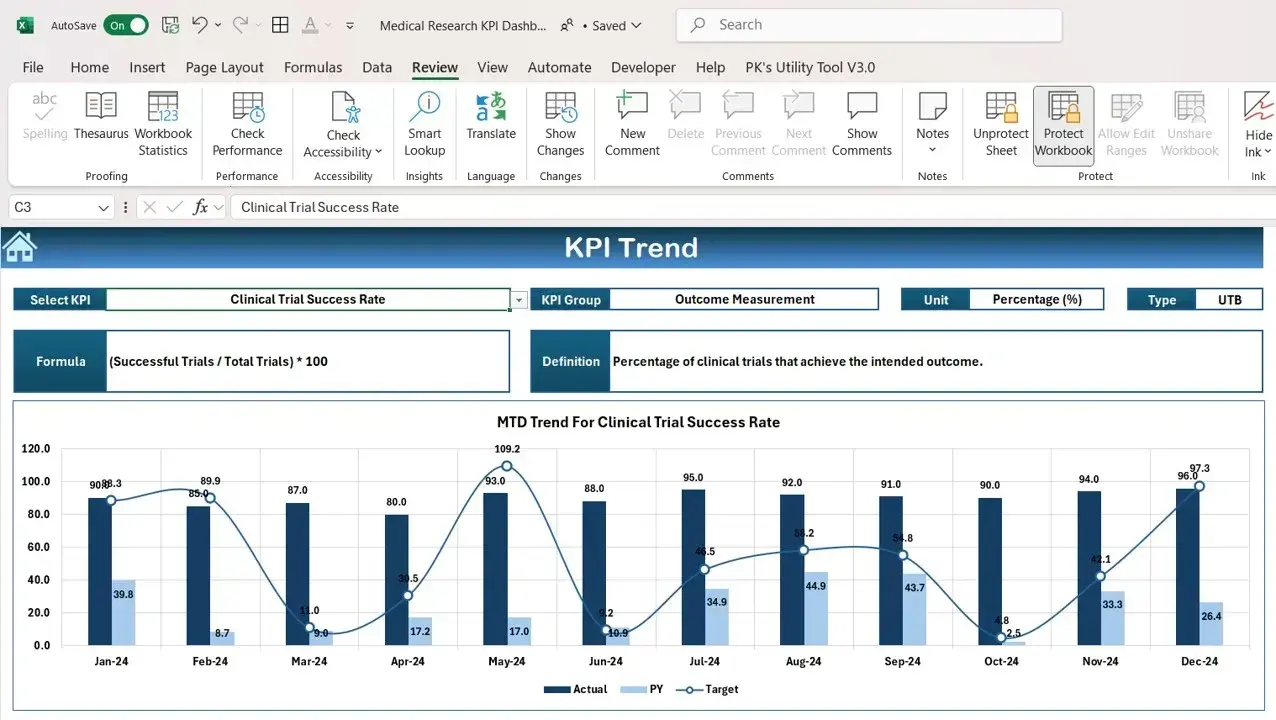
Patients records, Lab results , clinical results data are stored in excel . Lab results can be used to predict future outbreaks of diseases
This is an example of a medical research KPI dashboard in excell
3. Marketing and Sales
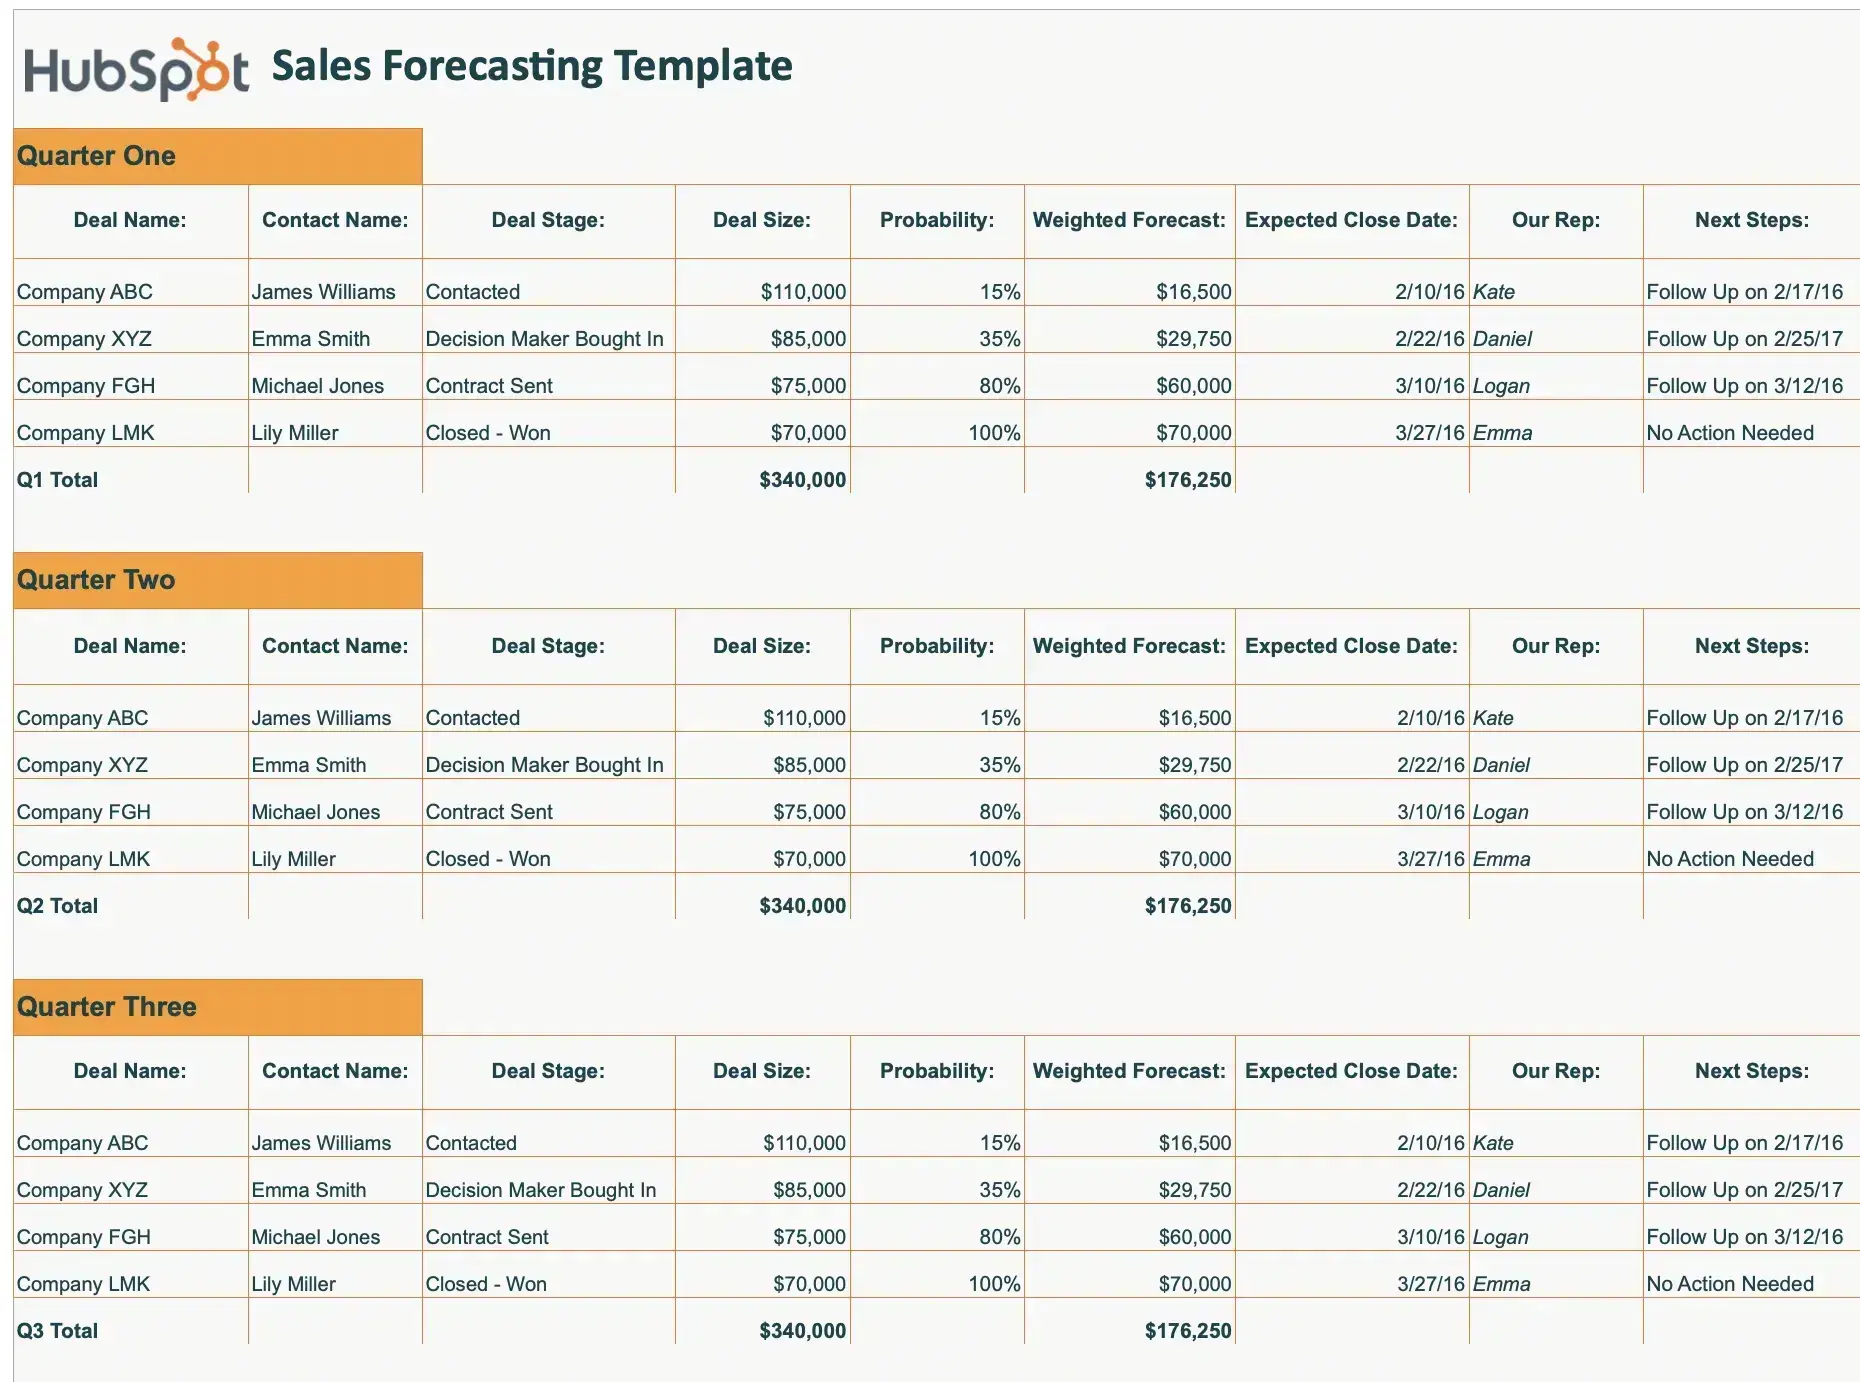
Excel is used in sales tracking, inventory control,revenue targets, conversion rates and supply chain management. Businesses can use formulas to calculate stock levels, reorder points, and sales growth trends. It helps companies reduce stockouts, prevent overstocking, and improve operational efficiency.
This is an example of an excel sales forecasting
4. Business forecasting & Decision making
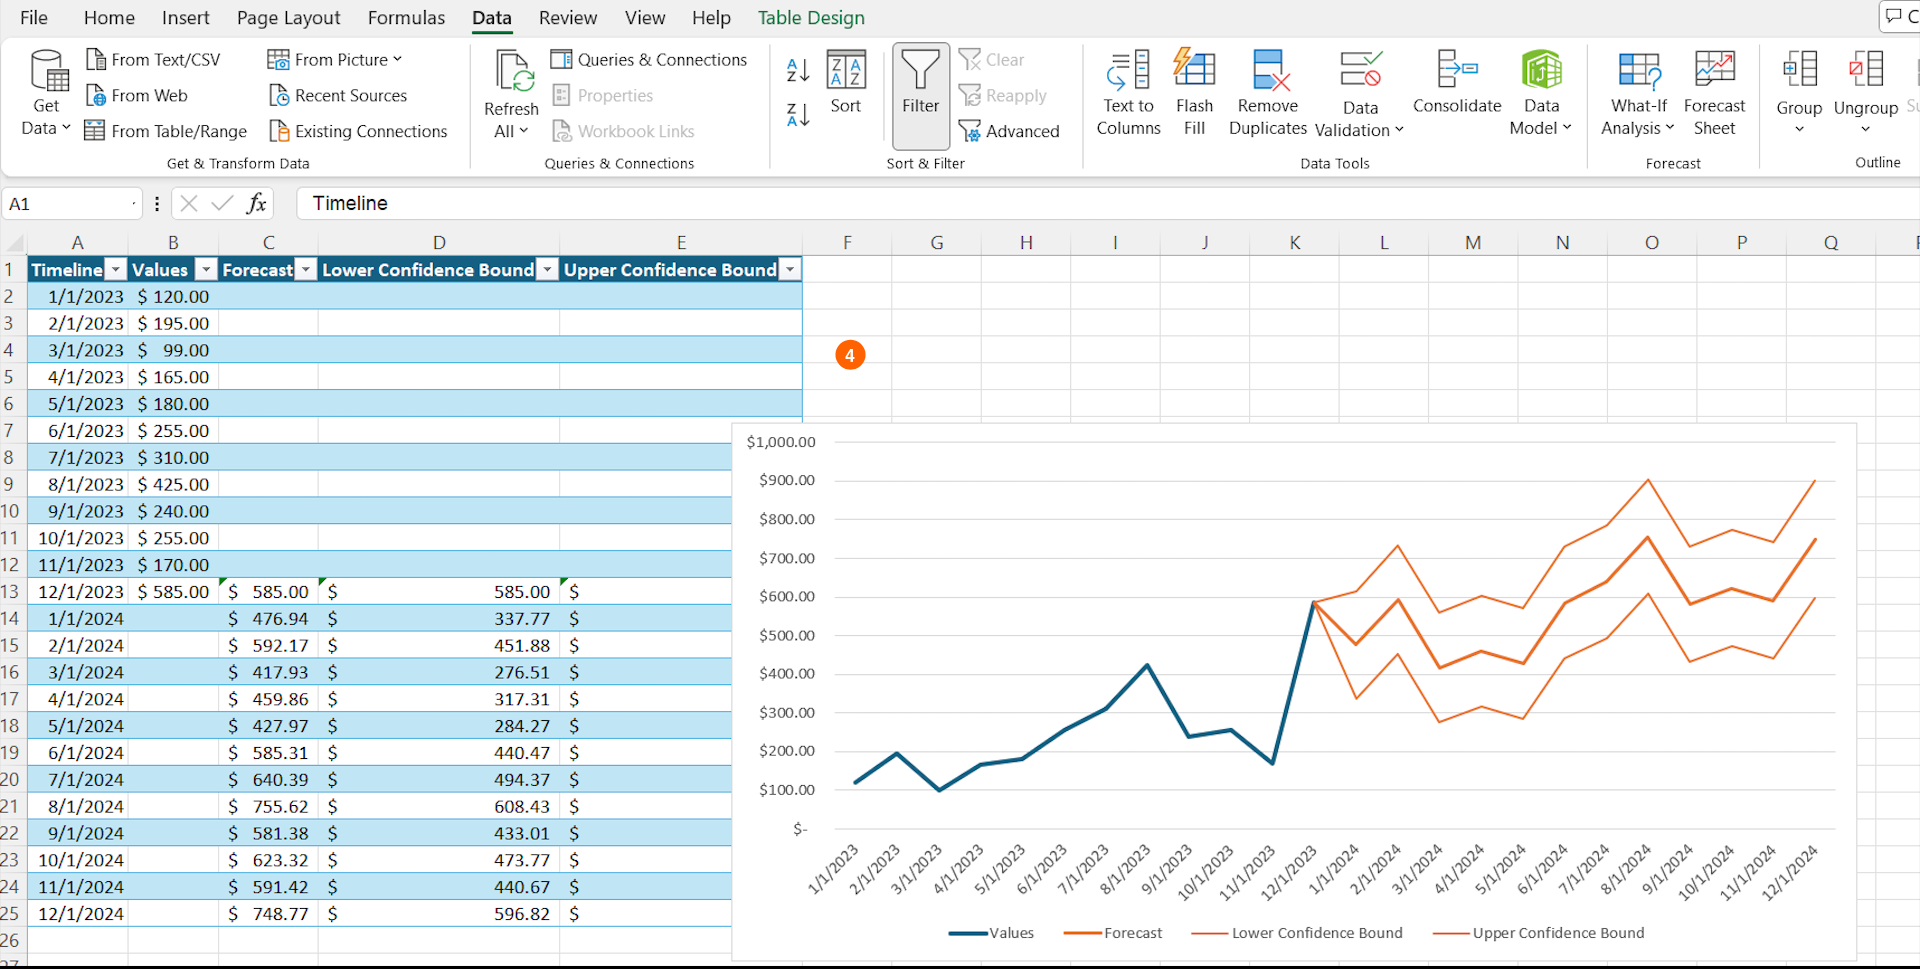
This is predicting what will happen in the future to be able to make decision based on the prediction.By using historical data and forecasting models, businesses can predict market trends,plan for future growth, assess risk and make data-driven decisions.
This is an example of a forecast sheet
5. Automation & Productivity
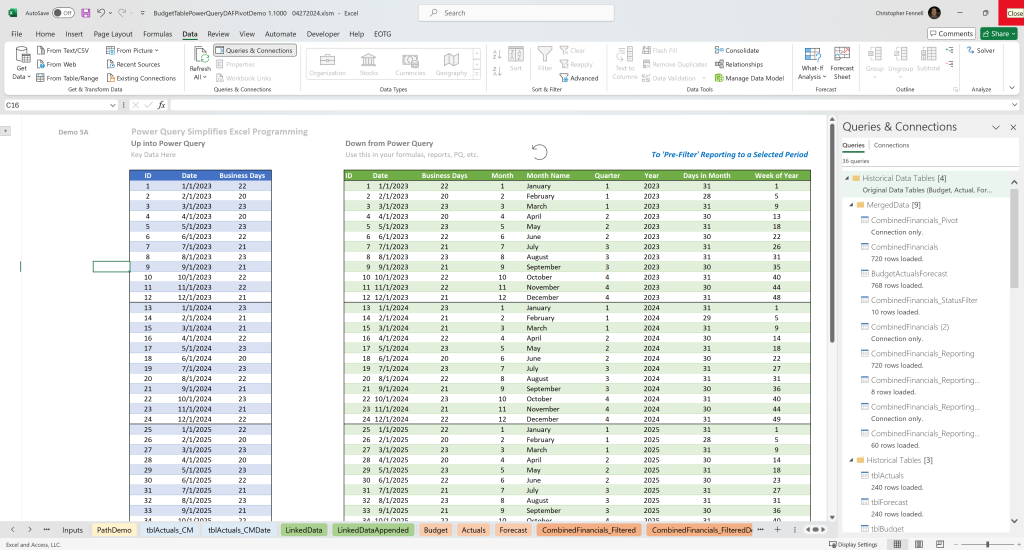
Excel automation features like templates and predefined functions help businesses save time and reduce manual errors. It allows companies to automate repetitive tasks such as data entry, invoicing, and payroll processing, increasing overall productivity.
This is an example of an automated Periods Table.
In excel they are very many function that makes data analysis simple . Here a few of the main functions one should know.
1. Sum
Adds all the values in the said range
E.g in the below it add all values from B2,B3,...,B8
=SUM(B2:B8)
2. Average
Finds the average of values in the said range
E.g In the below cell it finds the average of all values between cell D2,D3,...,D22
=AVERAGE(D2:D22)
3. Max
Finds the max number in said range of values
E.g In the below cell it finds the maximum number in all cells from F3,F4,...,F10
=MAX(F3:F10)
4. Count
Count cells with numbers
E.g It returns the number of cells with numbers
=COUNT(H2:H10)
5. Filter
Extracts data from a table based on criteria you specify.
E.g Checks the data and instantly spill out a list of only the rows where sales (Column C) are greater than 5000.
=FILTER(A2:C100, C2:C100>5000, "No Sales")
6. Sort
Sorts the contents of a range or array automatically.
E.g Sorts the data range based on the 2nd column, in descending order (highest to lowest).
=SORT(A2:B100, 2, -1)
7. IF
It checks if a condition is true or false and gives you a different result depending on the outcome.
E.g If a student's grade in cell B2 is 70 or higher, Excel prints "Pass". If it's 69 or lower, it prints "Fail".
=IF(B2>=70, "Pass", "Fail")
Returns the exact middle number in a given set of numbers.
E.g Finds the middle value of all numbers in that range.
=MEDIAN(C2:C50)
9. Mode
Returns the most frequently occurring or repetitive value in a dataset.
E.g It shows you which number is most frequently.
=MODE(D2:D100)
10. Proper
It capitalizes the first letter of every word in a text string and converts all other letters to lowercase.
E.g If cell A2 contains the messy text: "jOHN mCcLAIN" the formula will cleanly output: "John Mcclain"
=PROPER(A2)
11.COUNTIF
Returns the value in a given a range given one condition
E.g How many total deals did the North region close?
=COUNTIF(B2:B100, "North")
12. COUNTIFS
Returns the value in a given range with more than one condition
E.g Returns the number of deals in the North region are still 'Pending'
=COUNTIFS(B2:B100, "North", D2:D100, "Pending")
13.SUMIF
Adds the values in a range that meet a single, specified condition
E.g Adds the total revenue brought in by the sales rep 'Sarah'?
=SUMIF(A2:A100, "Sarah", C2:C100)
14.SUMIFS
Adds all numbers in a range that meet multiple conditions
E.g Adds total revenue brought in by 'Sarah' for deals larger than $10,000?
=SUMIFS(C2:C100, A2:A100, "Sarah", C2:C100, ">10000")
15. AVERAGEIF
Calculates the average of numbers in a range that meet a specific condition
E.g Calculate the average deal size in the South region?
=AVERAGEIF(B2:B100, "South", C2:C100)
16. AVERAGEIFS
Calculates the averages of numbers in a specific range based on more than one conditions.
E.g Calculates the average size of 'Closed' deals in the South region?
=AVERAGEIFS(C2:C100, D2:D100, "Closed", B2:B100, "South")
17. ROUND
Used to round a number to a specified number of digits
E.g A sales commission calculates out to $1,250.4567. You need to round it to standard currency (2 decimal places) for payroll.
=ROUND(1250.4567, 2) returns 1250.46
18. ROUNDUP
Used to round a number up
E.g You need to ship items to a client. A box holds 10 items, and they ordered 41 items ($41 / 10 = 4.1$). You can't ship 4.1 boxes; you must round up to ensure you have enough physical boxes.
=ROUNDUP(4.1, 0) returns 5.
19. INT
Rounds a number down to the nearest whole interger by removing its decimals
E.g An employee clocked 38.75 hours this week. You want to extract just the full, completed hours they worked.
=INT(38.75) returns 38
20.ABS
Returns the positive value of a number by removing its negative sign
E.g If a refund is logged as -$450.00, you want to know the absolute dollar volume of the transaction.
=ABS(-450) returns 450
21. TODAY()
Is a formula that updates the day automatically
E.g Finding out exactly what day it is today to calculate invoice aging.
=TODAY() returns 06/05/2026 (based on today's date)
22. NOW
Inserts the current date and time
E.g Stamping a report so stakeholders know exactly what minute the data was pulled from the server.
=NOW() returns 06/05/2026 15:02
23. YEAR
To extract year in a date
E.g You want to group sales by their calendar year.If cell A2 holds 06/05/2026.
=YEAR(A2) returns 2026
24.WEEKDAY
To extract the day of the week in excel
E.g Checking if a client submitted a payment on a weekend so you can account for bank processing delays.
=WEEKDAY(A2) returns 6 (which represents Friday)
25. WEEKNUM
Finds the week number of a specific date
E.g
Excel is a very important tool in Data analysis. We can say it the mother of all since it can do almost all the analysis. Excel needs to be one of the most important tools one has to learn to be able to understand data analysis.
