Your backtest shows a beautiful equity curve: steady slope, contained drawdown, high Sharpe. Before connecting it to real capital, ask the uncomfortable question: is that curve real, or the product of biases the market will bill you for later?
This is the practical companion to our validation guide (DSR/PBO, selection bias). If that one answers "how much can I trust this statistic?", this one answers "which data and execution errors are contaminating my results?".
Educational content: methodology, no signals, no return claims.
By Mahdi Goodarzi (g.dev/mahdigoodarzi), Gueta Quant — full Spanish guide with detection table at guetaquant.com/blog/backtest-8-sesgos.

1. Look-ahead: future data dressed as present
The most common and most expensive bias. The entry signal uses information that did not exist yet.
- Same-candle close: in TradingView,
close inside a forming bar already reflects the live price. A signal on close executed "at the open" uses that bar's close before it happened. Canonical fix: close[1] or lookahead_off in request.security.
- Session indicators: a Volume Profile computing POC/VAH/VAL with the full session range cannot decide inside that session. The level is only valid after the close.
- Re-optimization on the same history: optimizing on all data then "testing" on the same data is memory, not out-of-sample.
// Pine Script v6 — honest signal (no look-ahead)
sig = ta.crossover(close[1], ta.sma(close, 50)[1])
noFuture = request.security(syminfo.tickerid, timeframe.period, close[1], lookahead = barmerge.lookahead_off)
Detection (cheapest integrity test there is): force the signal one bar late and compare. If performance collapses, the signal depended on the future.
# Python — one-bar-late integrity test
import numpy as np
ret = np.asarray(strategy_returns)          # per-trade or per-bar returns
shifted = np.roll(signal, 1)                # execute one bar later
print("base Sharpe:", sharpe(ret), "| 1-bar-late Sharpe:", sharpe(ret_shifted))
# collapse => look-ahead contamination
2. Survivorship: the dead don't show on the chart
Testing "buy and hold" on today's top-20 coins ignores the hundreds of dead projects. Index backtests that exclude delisted/bankrupt constituents are biased upward.
Detection: ask which assets existed in the period but no longer trade, redo including them — or declare it as a known methodology limitation.
3. Selection: testing 45 strategies, reporting 1
Trying many variants and keeping the winner as if it were the only hypothesis consumes statistical degrees of freedom. The modern quantitative name: Probability of Backtest Overfitting (PBO). Log every trial, not just the winner — an experiment ledger (or plain spreadsheet with each variant + result) is the difference between research and anecdote. Full treatment: validating a backtest without fooling yourself (DSR + CSCV).
4. Execution assumptions: the market doesn't give you the best price
The backtest fills at the best hypothetical price; reality fills at the best available price minus spread, commission, slippage — sometimes through a gap.
- Variable spread (session open ≠ midday), commissions + swap on 50-trades-a-day MT5 strategies, stop-as-market-order slippage on news, limit-order fill fiction (unfilled limits that "would have lost" never count).
Detection: rerun with a pessimistic cost model (2× spread, half-tick slippage, full commission). Profitable → unprofitable with realistic costs = no edge, just underestimated costs.
# Python — pessimistic cost haircut
gross = np.asarray(trade_pnl)
costs = spread_cost * 2.0 + commission + slippage_half_tick
net = gross - costs
print(f"win-rate gross {np.mean(gross>0):.2%} -> net {np.mean(net>0):.2%}")
5. Repainting: indicators that draw with data that doesn't exist yet
A repainting indicator changes its past values when a new bar arrives because it was computed with the full forming bar. Volume-based levels (POC/VAH/VAL drawn mid-session) are the classic case.
Detection: TradingView bar-replay — if historical values shift as you step forward, it repaints. MT5 — compare the live-computed current bar vs the same bar reloaded after close. If they differ, no intraday signaling without a documented offset.
6. Data quality: gaps, adjustments, timezones
Weekend gaps in forex, local holidays on BVC, unadjusted splits/dividends in equities, and broker timezone ("daily" bar of broker A ≠ broker B, COT session alignment) all create trades at prices that never existed.
Detection: audit history continuity, compare two data vendors for the same asset/period, confirm bar timestamps match your production broker.
7. Small sample: statistics that mean nothing
Fifty trades look like a sample; statistically they are noise with aspirations. Practical rule: distrust conclusions under ~100 independent trades — and demand more for low-frequency strategies.
# Python — does the expectancy CI cross zero?
import numpy as np
mu, se = trades.mean(), trades.std(ddof=1) / np.sqrt(len(trades))
print(f"mean {mu:.4f} ± {1.96*se:.4f} (95% CI)")
# CI crossing zero => edge not demonstrated, however pretty the curve
Our local-first Monte Carlo simulator shuffles your real sequence to show how many alternative paths end in loss — a direct fragility read.
8. Outcome conditioning: stops that moved "just because"
The most human bias: adjusting after seeing the result — the stop moved "because that trade was special", the filter added "because it removed three losers". Each post-result tweak is conditioning.
Detection: reconstruct the strategy version that existed before seeing results. If you can't, you don't have a backtest — you have a narrative. Freeze the strategy, lock an untouched holdout, log every change.
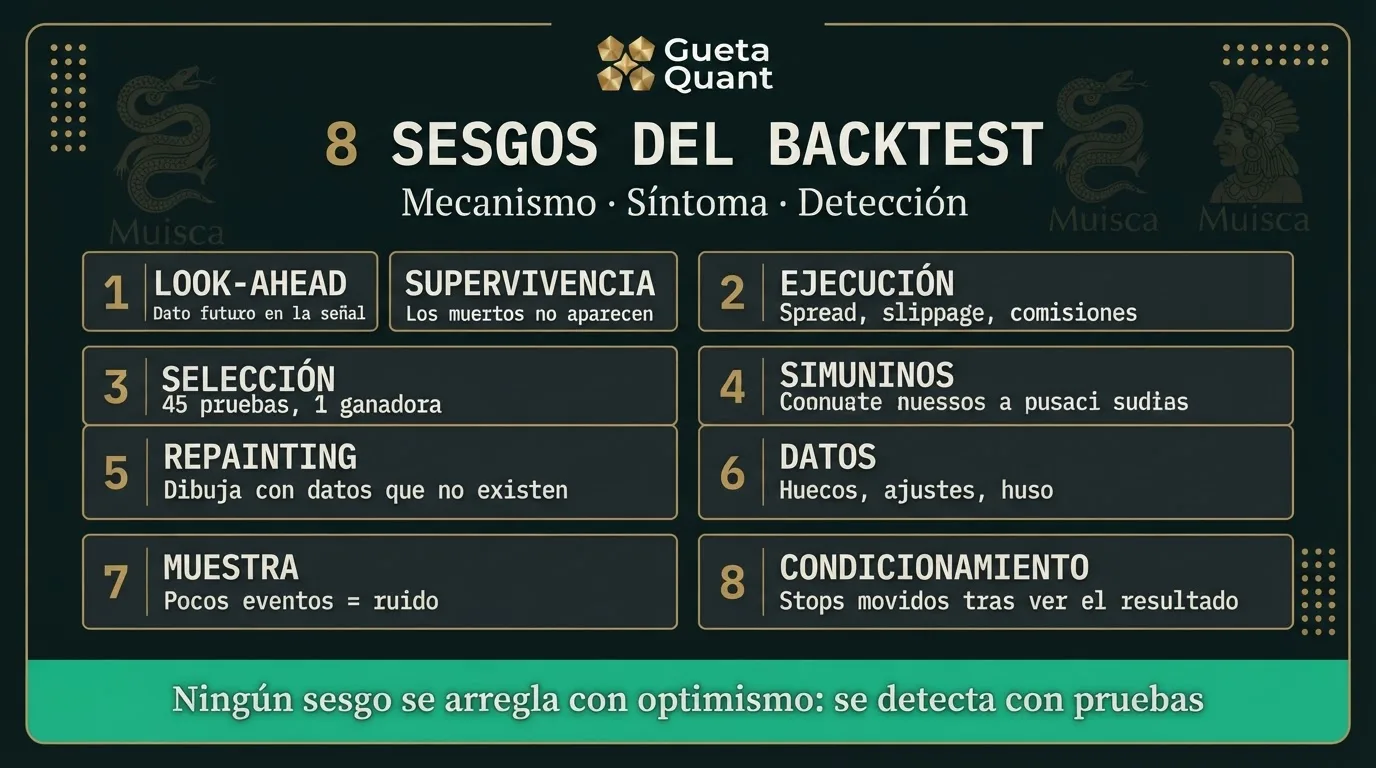
Quick detection table + minimum protocol
| # | Bias | Symptom | Detection |
|---|
| 1 | Look-ahead | Dies one bar late | close[1] / lookahead_off re-run |
| 2 | Survivorship | "Too good" on survivors | Include delisted or declare limit |
| 3 | Selection | Best-of-N as only | Full experiment ledger + DSR/PBO |
| 4 | Execution | Dies with real costs | Pessimistic cost model |
| 5 | Repainting | Levels shift retroactively | Bar replay / live-vs-closed compare |
| 6 | Data | Trades in gaps/wrong TZ | Continuity audit + 2 vendors |
| 7 | Sample | Pretty curve, <100 trades | Expectancy CI crossing zero |
| 8 | Conditioning | Post-result tweaks | Pre-result reconstruction + holdout |
Minimum before risking capital: (1) one-bar-late integrity run, (2) realistic cost model, (3) 100+ independent events with CI not crossing zero, (4) full experiment log, (5) untouched holdout, (6) DSR/PBO + Monte Carlo on your own sequence. Operational side: MT5 backtesting · TradingView backtesting · Walk-Forward.
Study material under Colombia SFC Decreto 2555 de 2010 — financial-engineering education, not investment advice. No signals, no managed accounts. Related: Why Perfect Backtests Fail (Walk-Forward + Deflated Sharpe) · Monte Carlo permutation testing.
