Introduction
Anybody can be a data analyst,but what separates a good data analyst from a great one is what you can do and present.In this article i will be giving step by step guidelines from turning a raw data to an interactive business dashboards and giving insights.We will generate our sales data from Mockaroo,use Python to turn the JSON file to CSV,analyse with Sql and visualize with Power Bi.
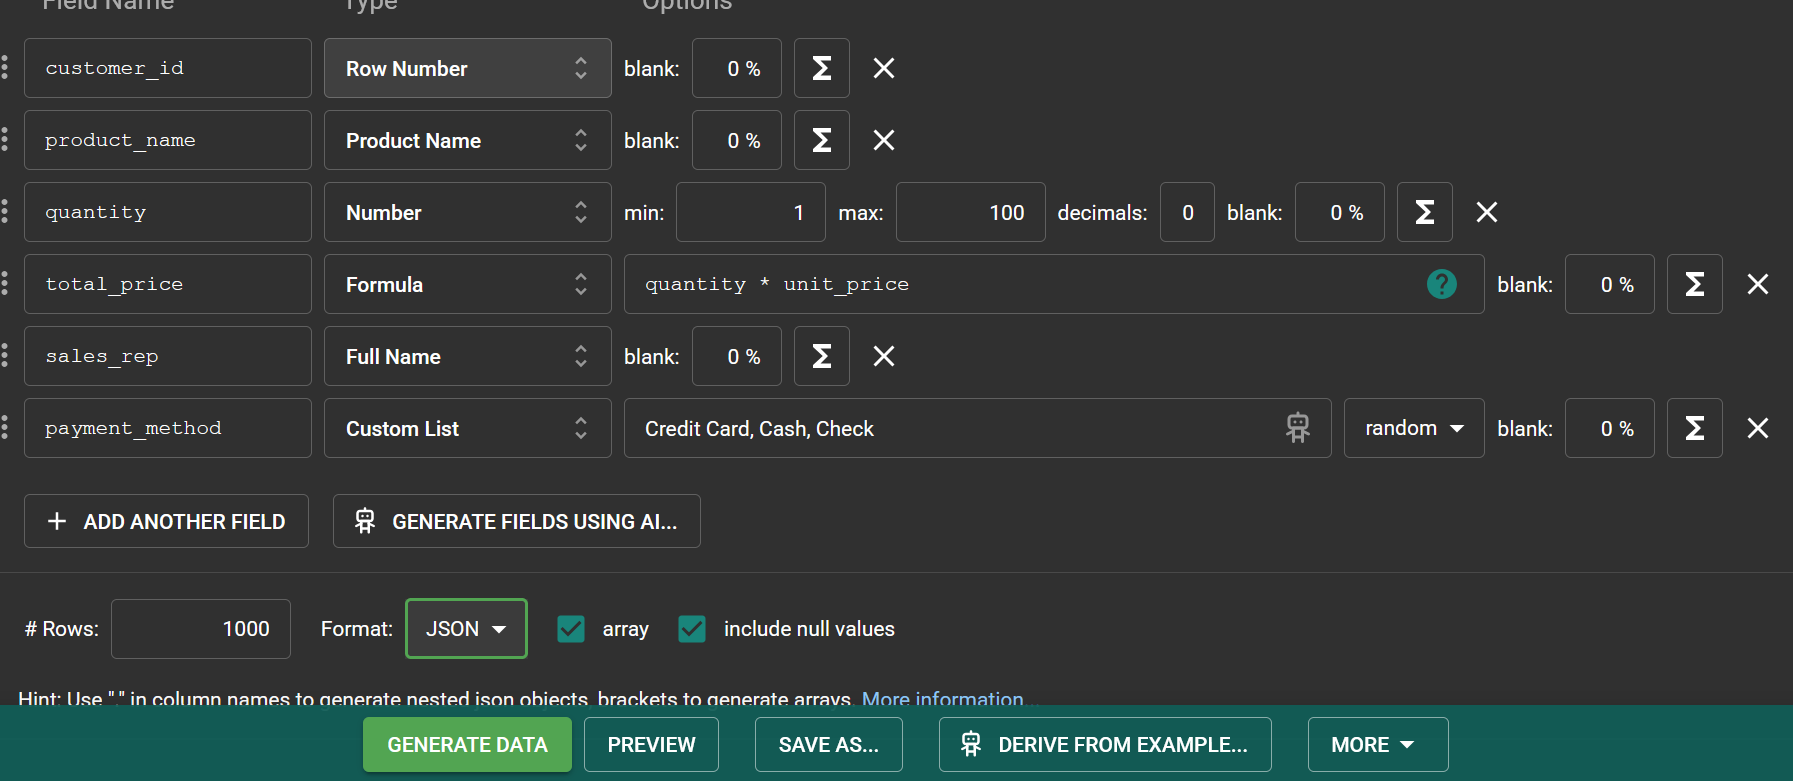
1.Generating the sales data.
You will go to your browser and search Mockaroo.com.Once open,hit the generate data button and give AI a command to generate the data for you.You can select the number of rows that you want your data to have.Once its done,save the data as a json file.
a.Viewing the data
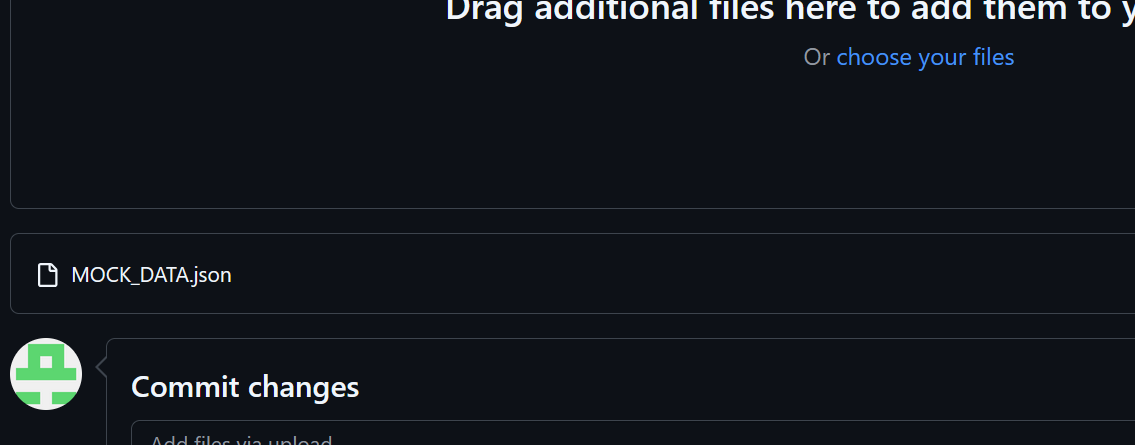
Once your data is generated and saved in your files in your machine,go to your Github account and add that file to your repo.
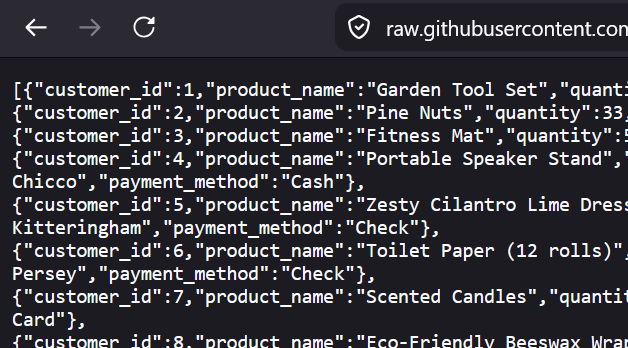
Once you open that file,hit the raw button and you will see something like this:
2.Importing using Python.
The work is not yet done.Copy the link from your raw data in github because we shall need it.Use the import requests and the url will be your link you copied from raw data in github.While pasting the url,ensure it has the either the double or single quotes at the start and at the end of the url link.The status code must always be 200.
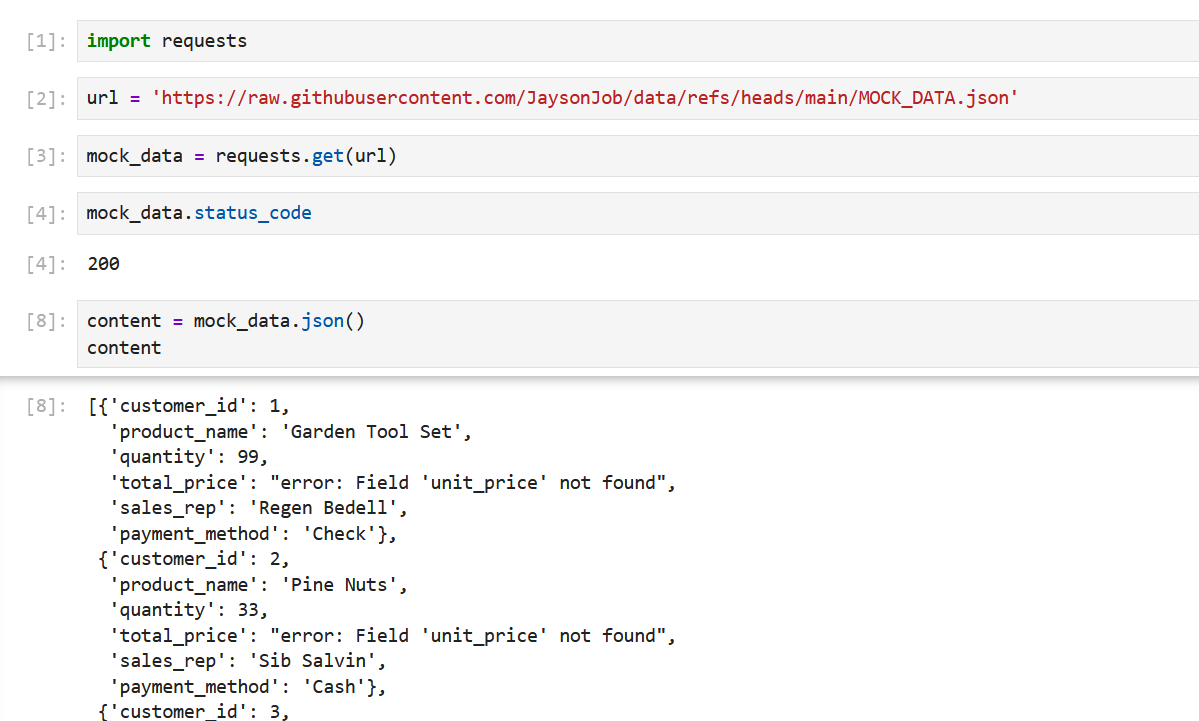
The next step will be seeing the type of data that we have,either a list or dictionary.
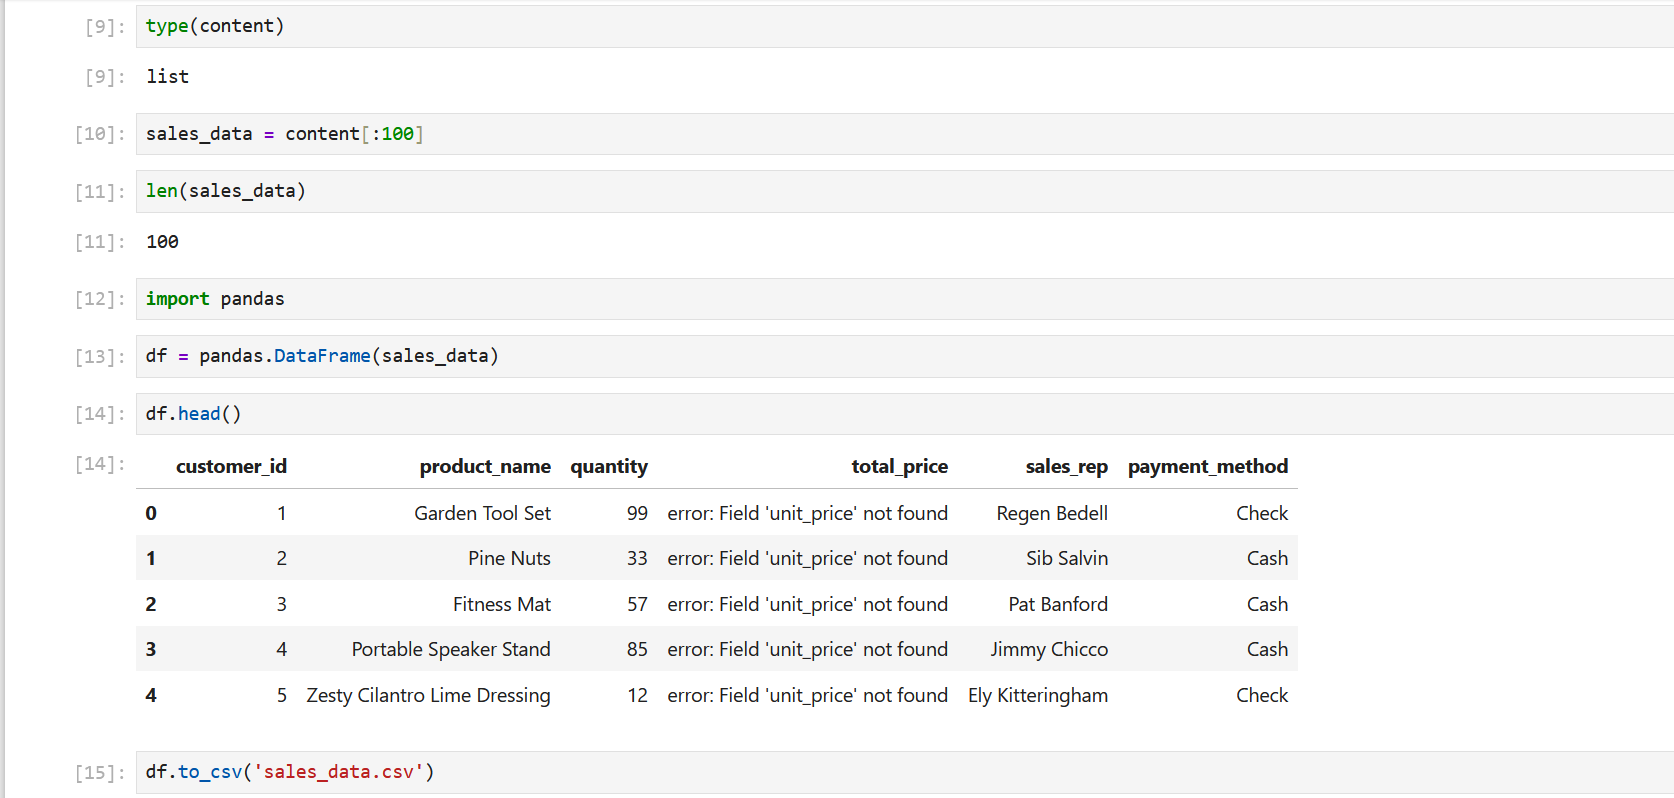
We have created a data frame,viewed the first rows and saved the the data as csv.
You should be seing the sales data as an excel file in your files ready for analyzing.
SQL analysis
Since we already have our data as CSV,we will import it in any sql environment you use.I will be using DBeaver.First you create a schema called sales_data or any name of your choice,then creating the sales table.
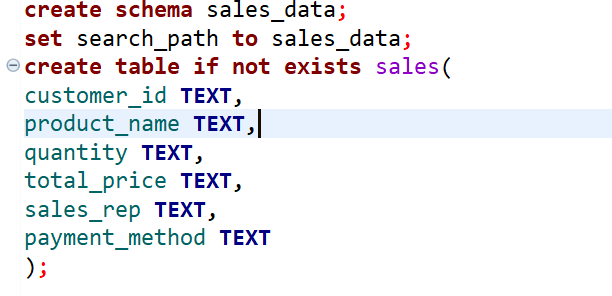
1.creating the table
You create a schema called sales_data or any name of your choice,then creating the sales table.Every column name will be kept as texts.Why,to avoid data type errors during import and to handle missing values,weird formats or nulls with ease.
2.Importing the data to SQL environment
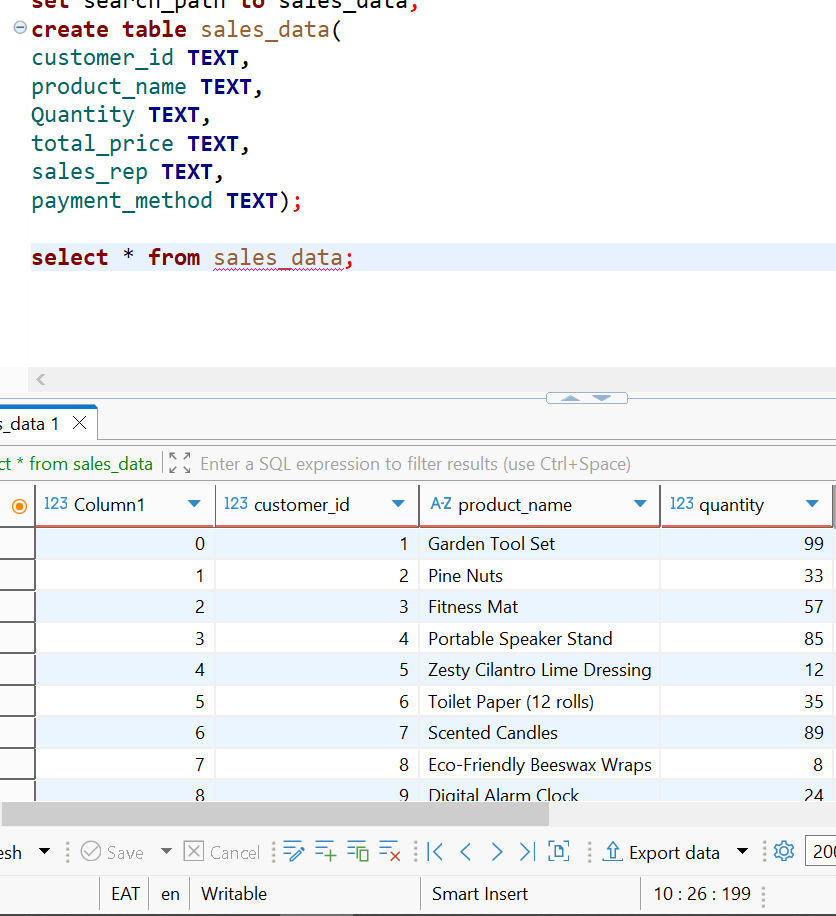
first,you go to your schema,refresh and search for your table name.Right click it and hit the import data button.Import the csv then press next,hit the browse button to select which file exactly that you want,then press next till you proceed to the next part.After importing the data,hit the refresh button on the table name below your schema to ensure the data is set.You can now write a query to see your data
b.cleaning the data
This is where most data analyst spend most of their time.With reference to my sales data,it's not so messy only few mistakes like fixing the total_price column.
1.fixing the total_price column
As i imported my data,the column total_price was full of error
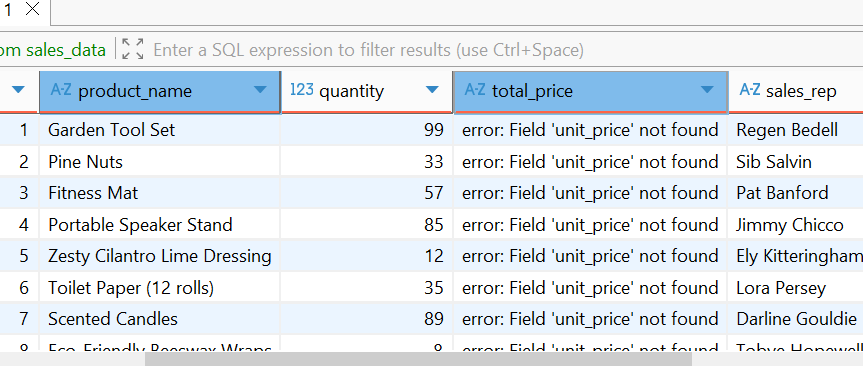
I will fix it by step by step as shown below.
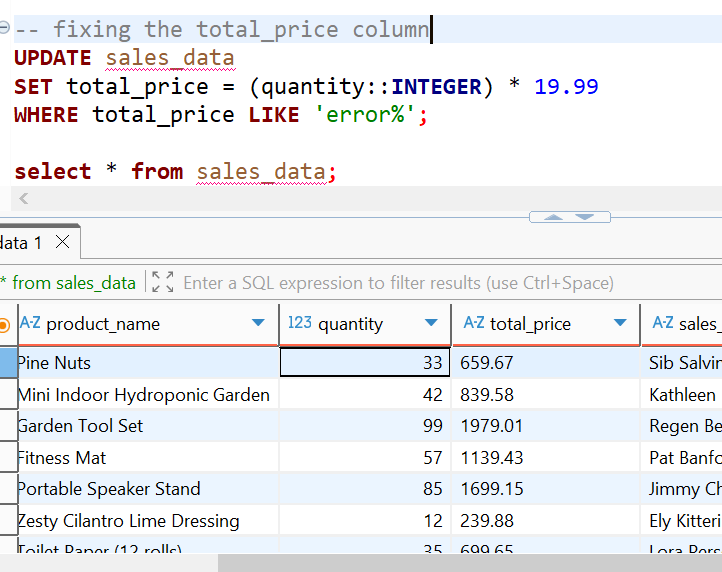
This SQL command fixes the total_price column by converting the text-based quantity values to integers using ::INTEGER,then multiplying each by a flat rate of $19.99.The WHERE clause targets only rows where total_price still contains the error message,leaving already-corrected rows untouched.
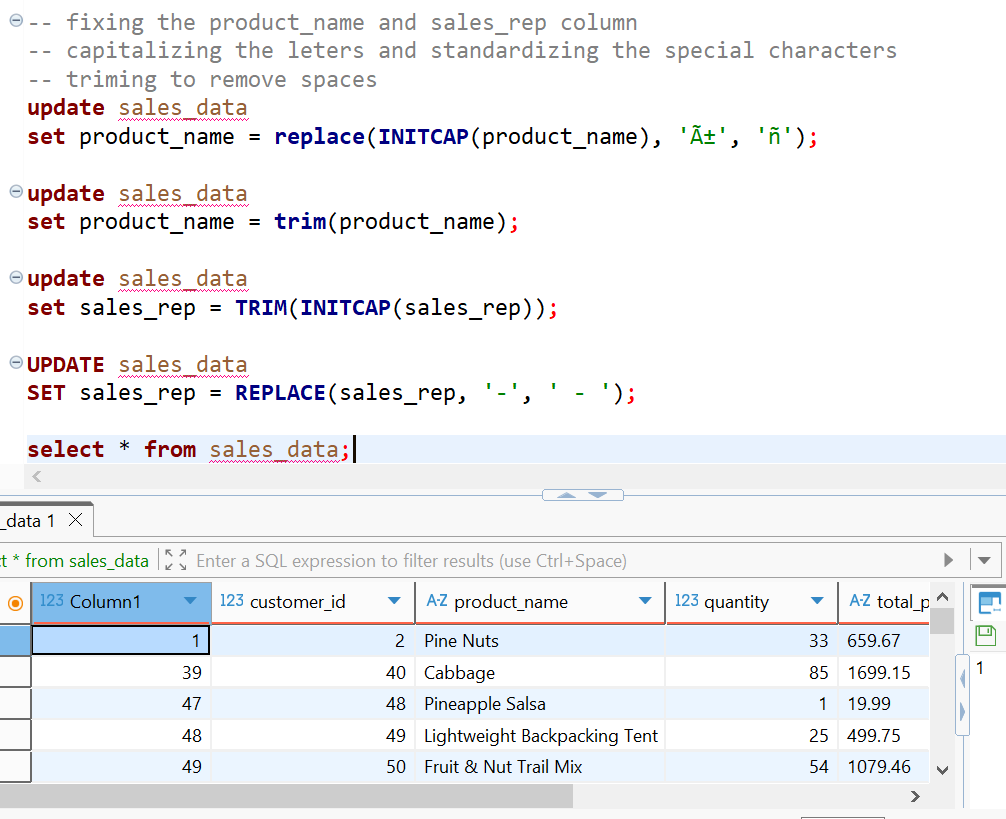
2.Trimming,capitalizing and removing special characters
Triming in SQL eliminates spaces before and after any word.Initcap is a special command that allows you to standardise the letters of words inside your columns.This is a similar command to 'proper' as used in My SQL and other SQL environment.
Now that our data is clean,we proceed to the next step which is answering business questions.Our data was not so messy so we used little times as possible.
c.Re-creating the clean table.
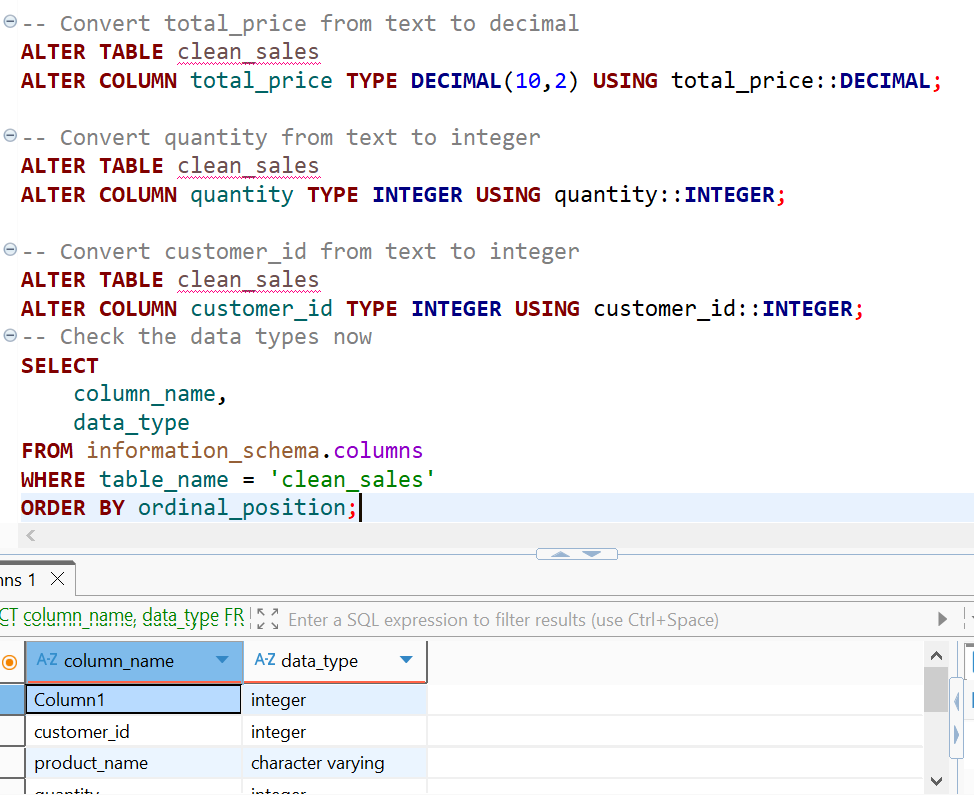
Since our data was stored as texts format,before analysis we should ensure everything is in its correct format as we did in cleaning.
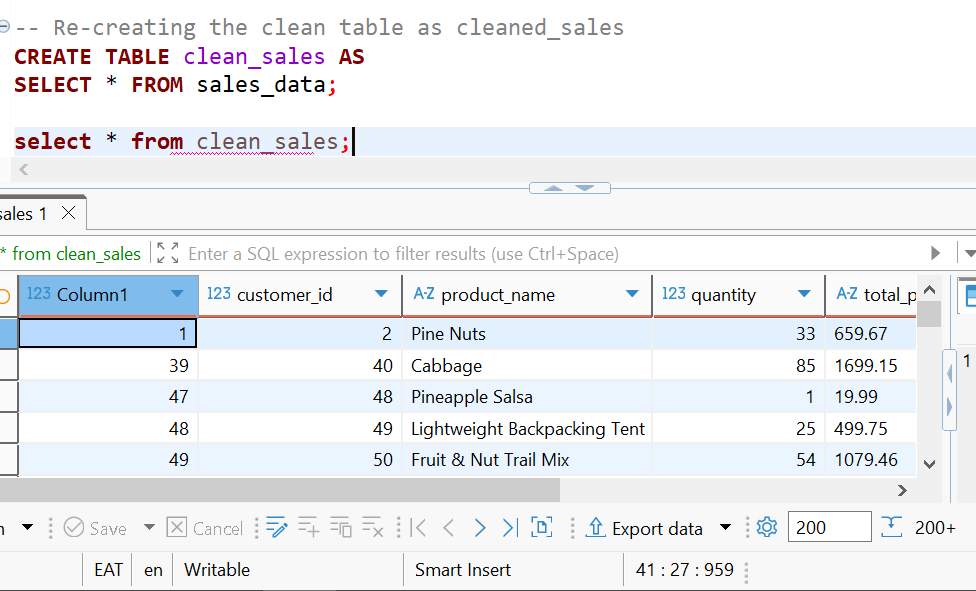
Some of our columns are not in their corect format.We can change them manually by writing a simple query by altering the table.
d.Answering business questions
This part is so important since we shall use it in visualization.Answering business questions like:sales performance,product analysis,customer insights and operational questions
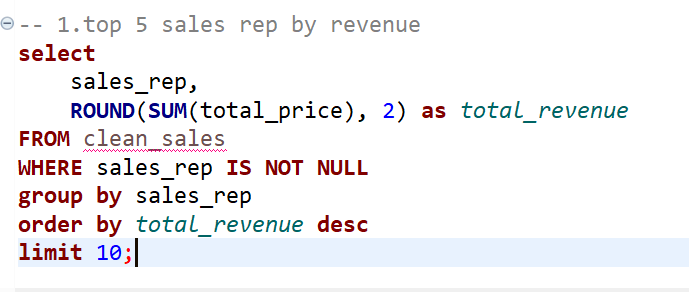
1.Finding top 10 sales rep
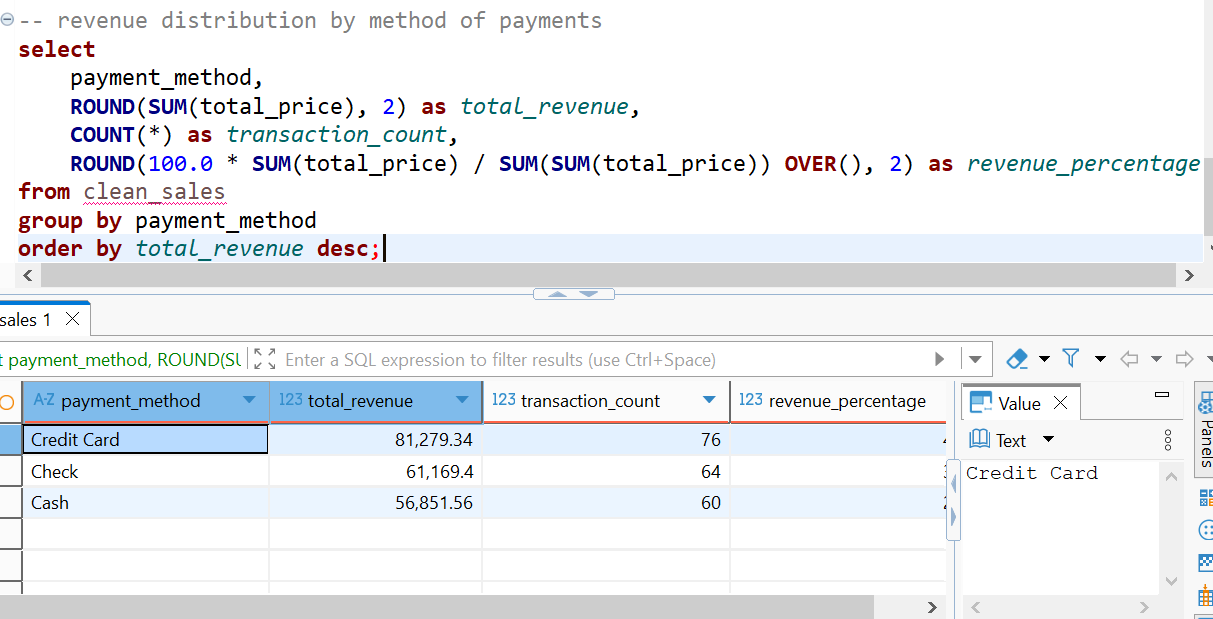
2.finding which method of payments produces more revenue
You can answer a lot of business questions as possible.I shall leave a link to my github for you to go through the business questions and answers.
Creating views
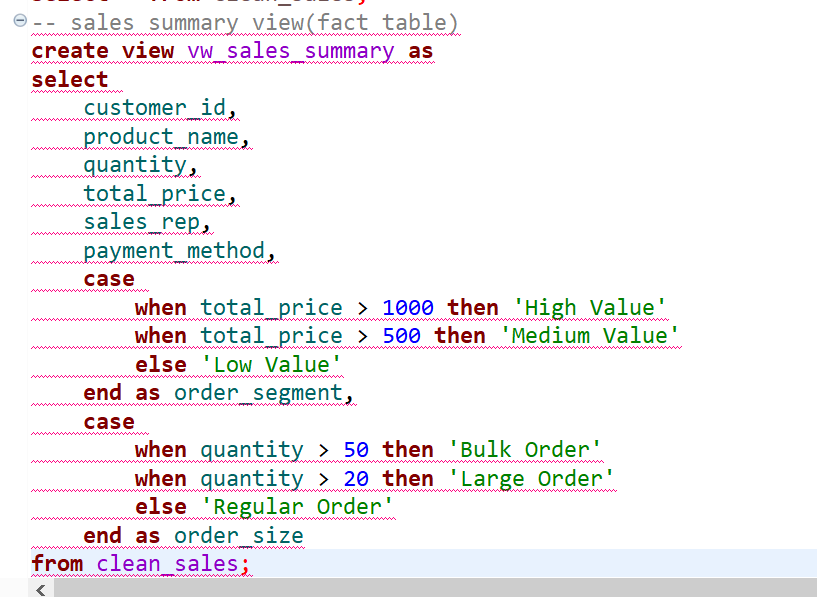
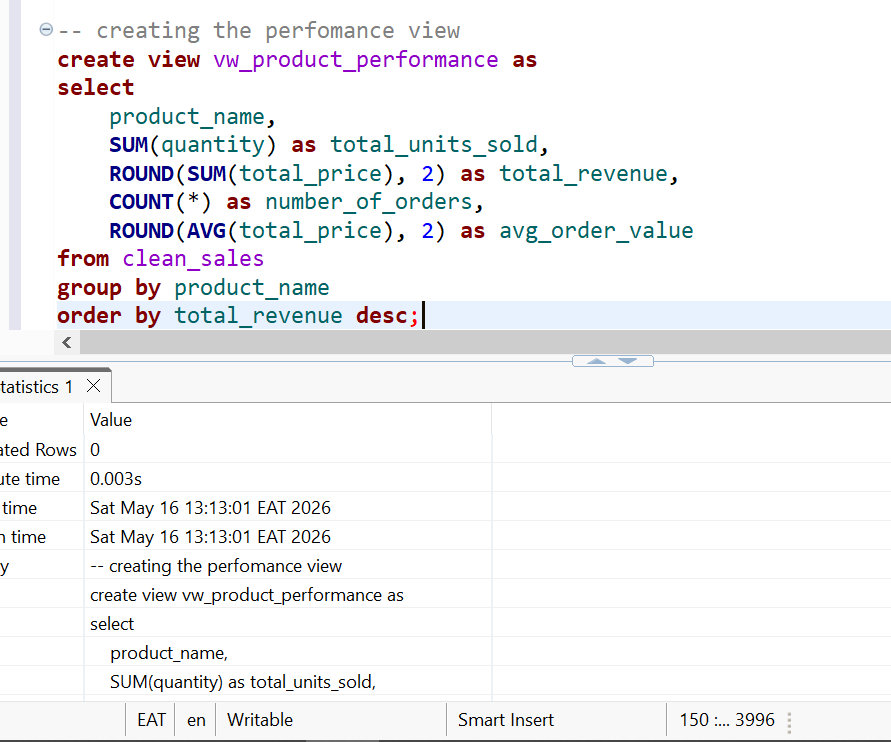
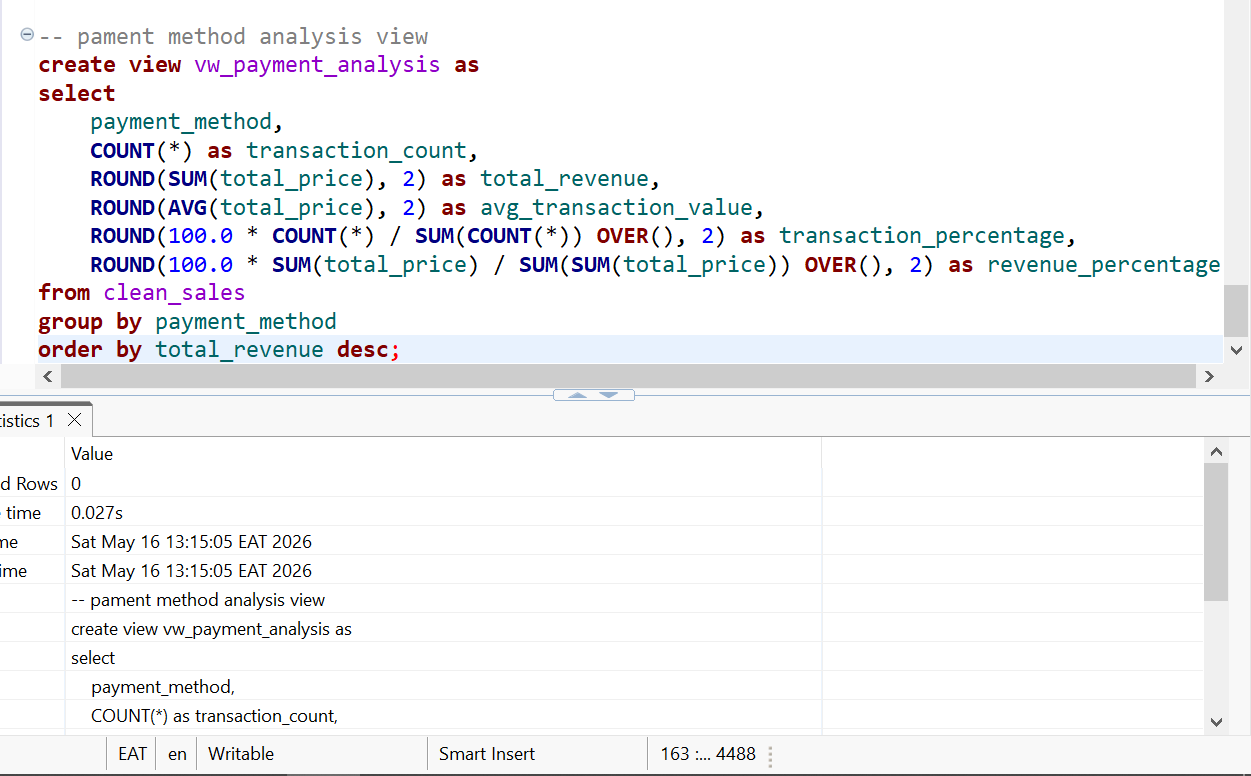
Views in SQL simplifies your work as a HR or a CEO since you don't have to go through every long queries.We shall also be using the views created in Power BI in creating visuals.We will be creating payment method analysis view,products perfromance views,sales perfomance analysis view and sales summary analysis view as our facttable.
The query worked well and now we have the sales view.
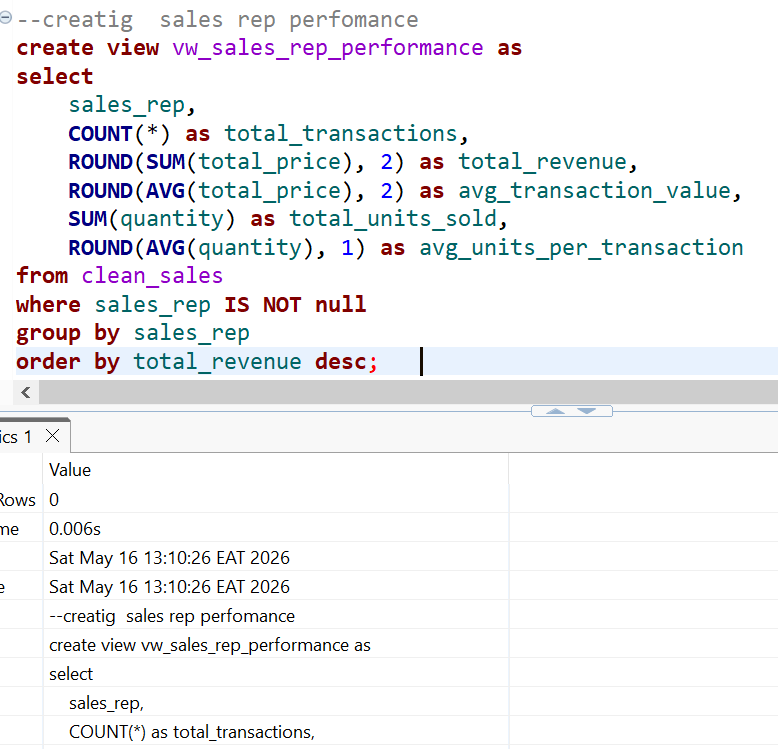
We have also created the sales rep perfomance view successfully.
The product perfomance views is also created successfully:
A payment method analysis view is also important we should have it as one of our views created:
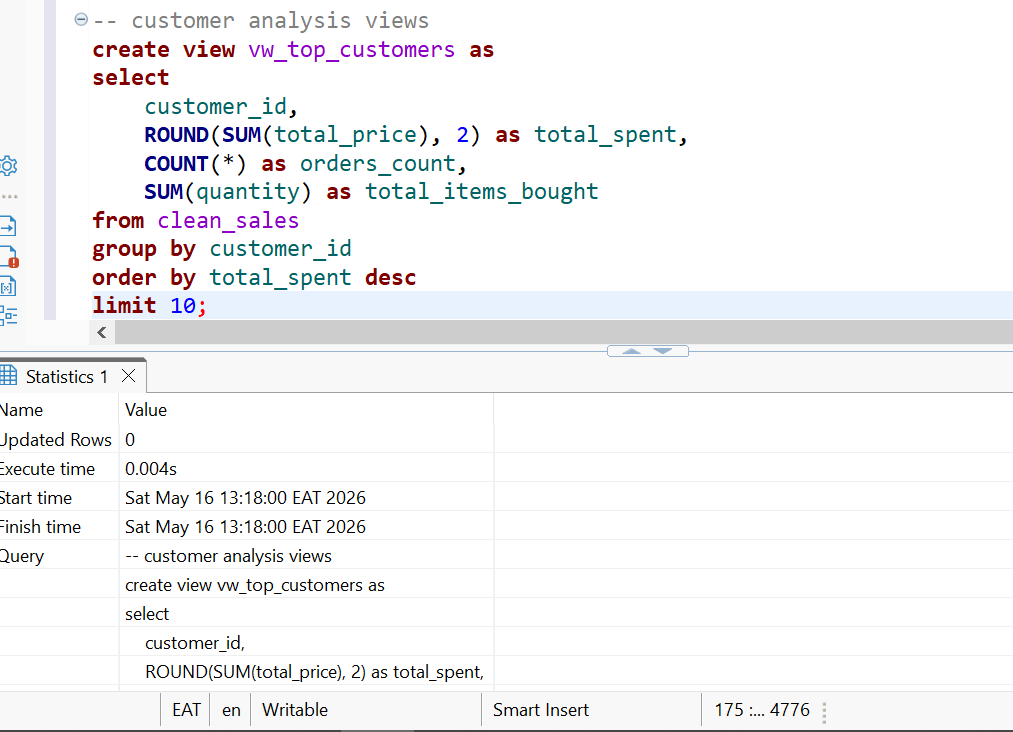
Lastly,we must track down our customers so i created another view called customer analysis view and was succesfull
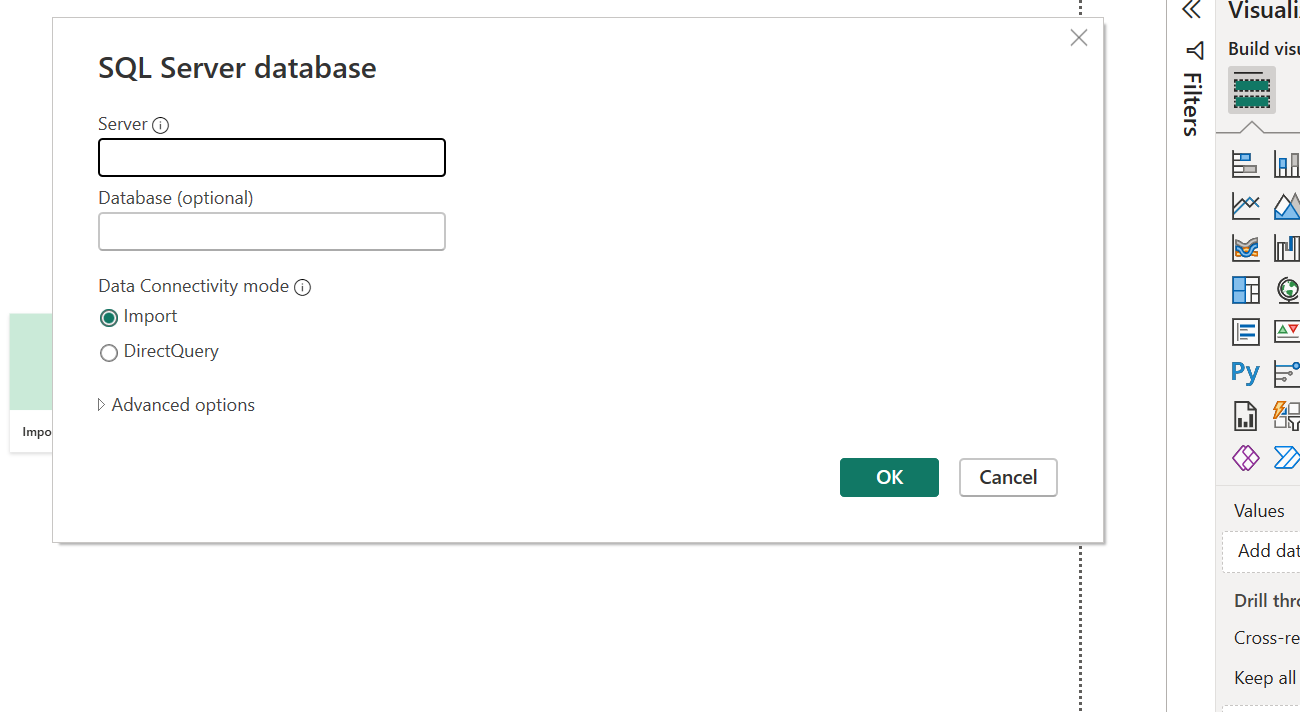
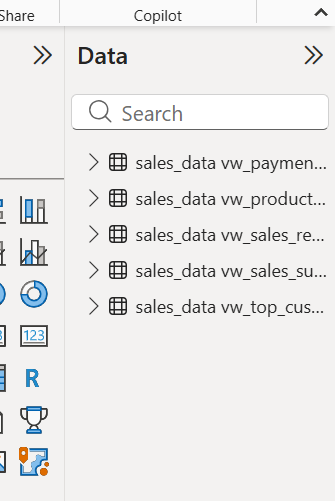
3Linking our sql environment to Power BI
since we have our views created,we shall be using them in Power BI.
1.Open Power BI and tap the home page,hit the import data from sql server then fill the required item:
2.Once you have already linked,select only the views we created in sql earlier as in our case.It will appear as shown:
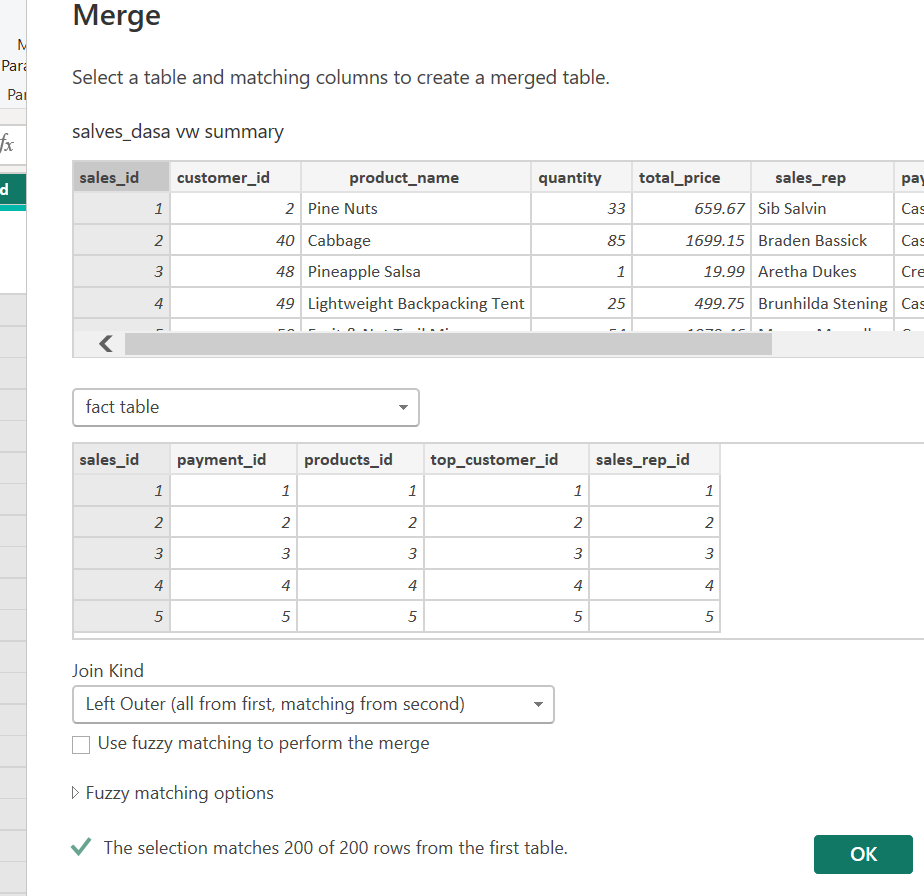
4.Creating relationships.
Since we have 5 different mini-tables,we will create one called a fact table that will have a link to all the other tables.We will add a new column in each of the 5 different table called 'ID' column in relation with the name example 'product_id,sales_id'.After adding the new columns,we copy and paste them inside the fact table.
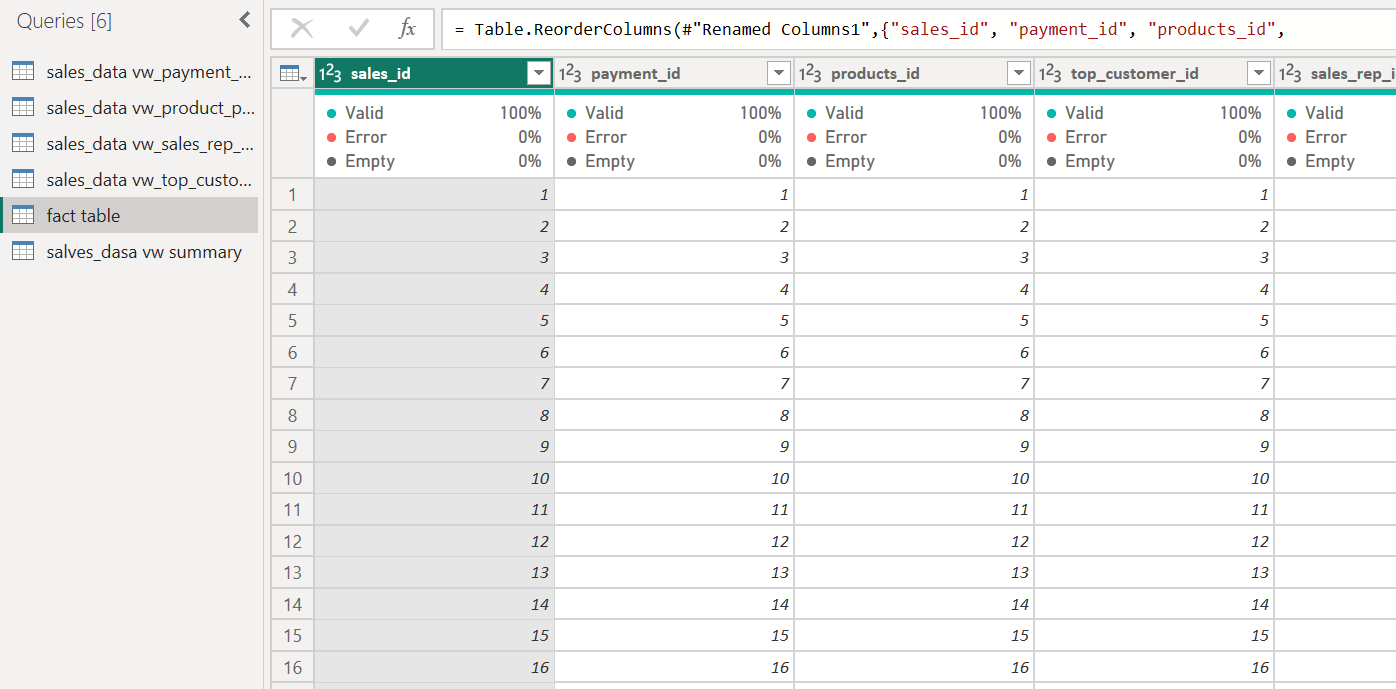
After adding the new column having the ID,we will merge queries them together to the fact table.Joining the common columns.
NOTE:You only select the common column(left outer join).
5.Creating dashboards
Once you have all the relationships,you can present your data in the forms of charts or any visual of choice.
This below is one of the examples i came up with:
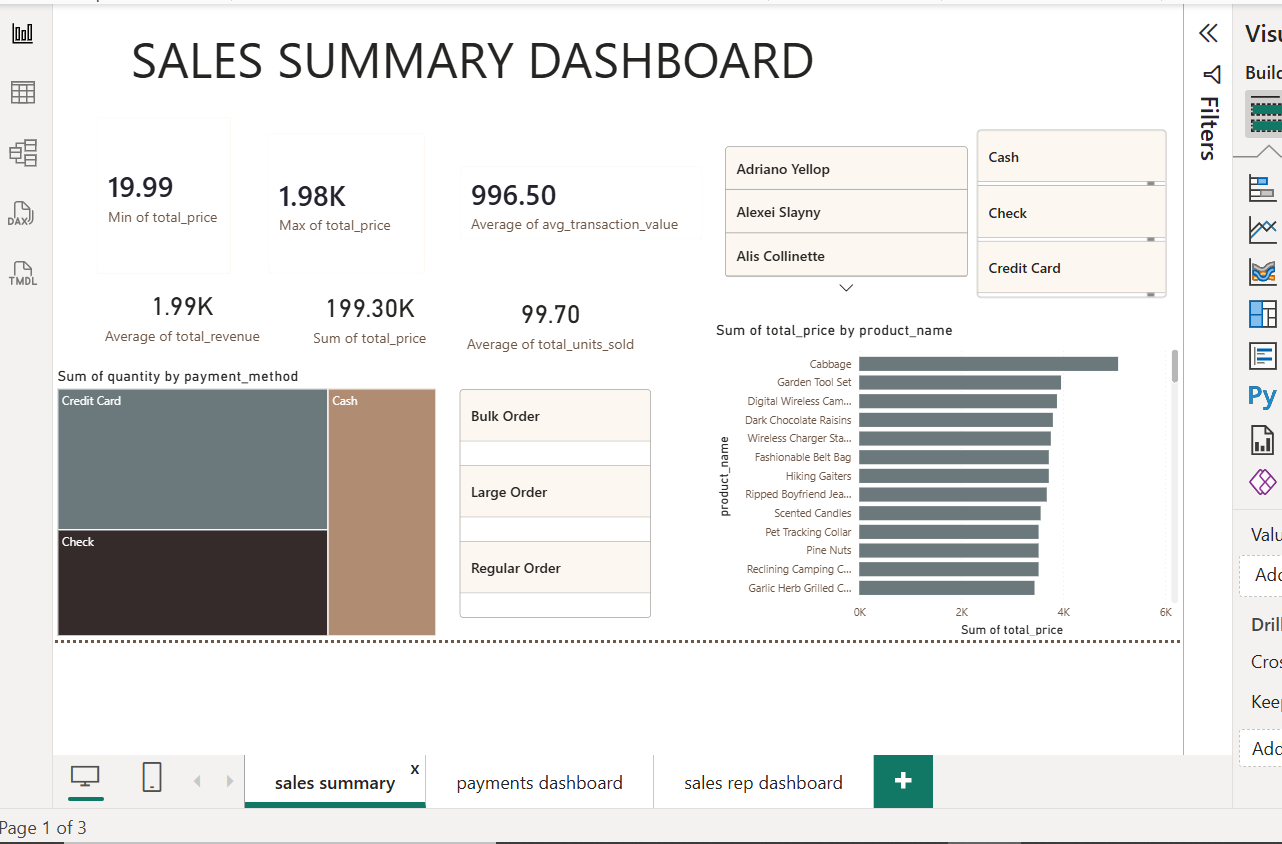
You can have up to 5 maximum pages of different charts
6.Report and Insights
Open a new page called report and insights and select a text box since we shall be using texts a lot more than charts.
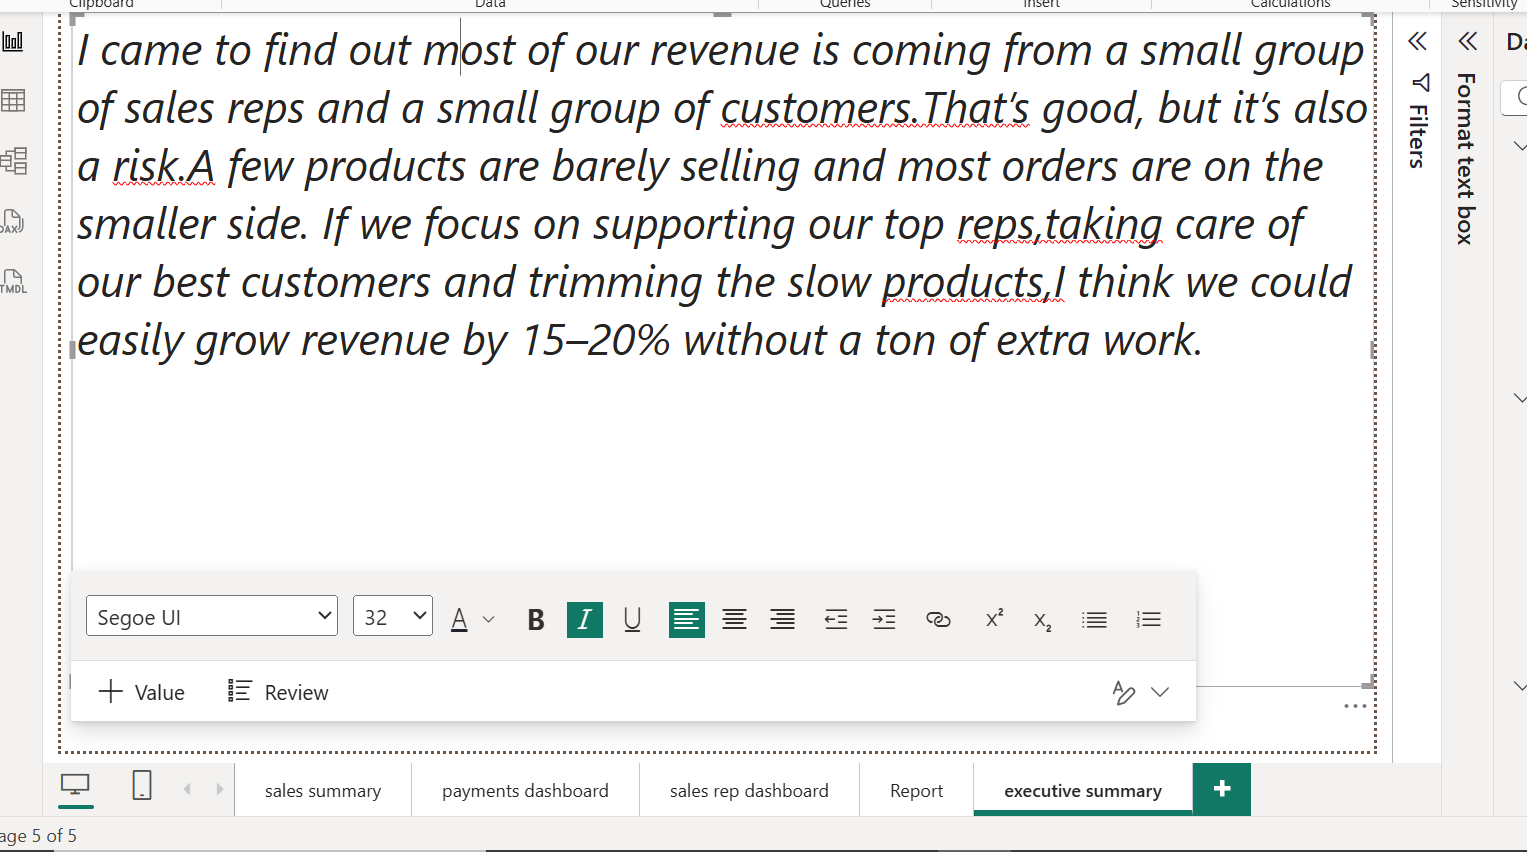
You can create a page called recommendation,executive report and so on.This can be presented to your boss with ease:
Conclusion
That one right there is a full data analyst project we did.We used tools like Python to import the data,SQL for analysis and creating visuals using Power BI.You can add it to your portfolio as one of the Projects and can help you land a job with ease since you have proof.
You can check more analysis i made using SQL :https://github.com/JaysonJob/full-sales-data-analysis/blob/main/Script-35.sql
I hope you found this article useful.Ciao