In every Private Equity investment committee, M&A due diligence process, or annual strategic planning session, a recurring analytical flaw surfaces: when evaluating market entry, pricing power, or long-term margin sustainability, teams project a slide featuring Michael Porter's 5 Forces populated with subjective bullet points and qualitative labels ("High Rivalry", "Moderate Buyer Power", "Low Threat of Substitutes").
While Michael Porter's structural framework (Competitive Strategy, 1980) remains the single most robust microeconomic lens for understanding how industry structure drives long-term profitability, its traditional qualitative application fails in the C-Suite for three structural reasons:
- Visual Equivalence Bias: In a standard 5-box diagram, a critical customer concentration risk (e.g., top 3 buyers accounting for 55% of annual revenue) occupies the exact same visual weight as a minor regulatory licensing hurdle.
- Lack of Cross-Elasticity & Asymmetric Weighting: Not all five forces exert equal pressure on a given industry's Return on Invested Capital (ROIC). In B2B SaaS, switching costs and substitute automation dominate margin structure; in heavy manufacturing, exit barriers, minimum efficient scale, and supplier power dictate survival.
- Zero Financial Statement (P&L) Connectivity: Once the workshop ends, the slide is archived. Neither the CEO nor the CFO can translate "Medium-High Buyer Power" into an expected EBITDA margin compression (in basis points), a ROIC − WACC spread projection, or a prioritized CAPEX/OPEX defensive moat budget.
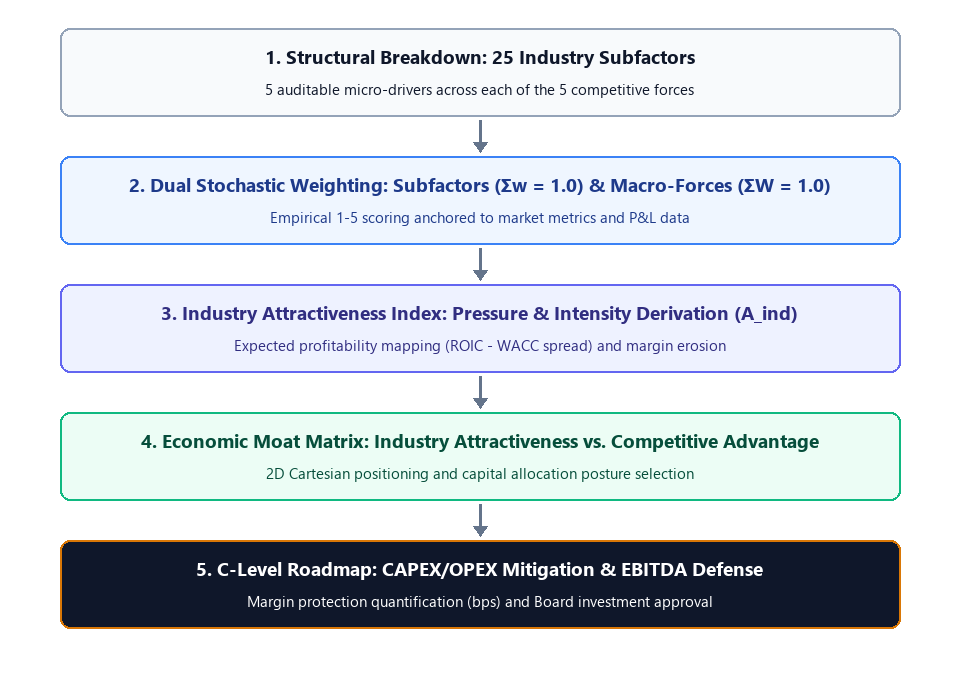
To pass scrutiny before a Board of Directors or Investment Committee, industry structure analysis must be upgraded from a qualitative brainstorming exercise into a doubly-weighted mathematical model coupled with an actionable capital allocation roadmap.
1. The Microeconomic Foundation: Why Industry Structure Dictates ROIC
Before formalizing the mathematical model, we must anchor the methodology in corporate finance fundamentals. A company's ability to generate economic value depends on maintaining a positive spread between its Return on Invested Capital (ROIC) and its Weighted Average Cost of Capital (WACC):
Economic Profit (EVA) = Invested Capital × (ROIC − WACC)
Michael Porter's core thesis is that ROIC is not determined solely by internal operational efficiency, but by the structural configuration of the industry in which the firm competes. Specifically, five structural forces continuously conspire to compress the ROIC − WACC spread toward zero—either by driving down prices, inflating input costs, or requiring escalating defensive capital reinvestment.
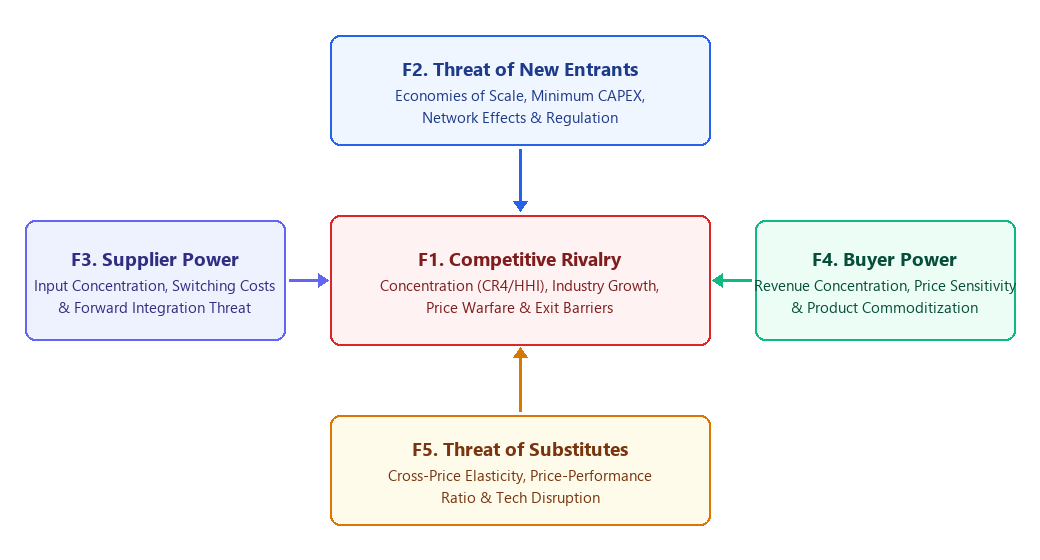
The 5 Structural Forces & Their 25 Auditable Micro-Drivers
To eliminate executive subjectivity, our quantitative framework decomposes each of the 5 macro-forces into 5 standardized, auditable subfactors (25 structural variables in total):
| Competitive Force | Structural Subfactors Evaluated | Direct P&L / Balance Sheet Impact |
|---|
| F1. Competitive Rivalry | 1. Market Concentration (CR4 / HHI)
2. Industry YoY Growth Rate
3. Fixed-to-Variable Cost Structure
4. Product Differentiation vs. Commoditization
5. Exit Barriers & Asset Specificity | Gross Margin & Commercial OPEX: High rivalry triggers price wars (gross margin erosion) and inflates Customer Acquisition Cost (CAC). |
| F2. Threat of New Entrants | 1. Economies of Scale & Learning Curve
2. Minimum Efficient Scale CAPEX
3. Access to Distribution Channels
4. Network Effects & Incumbent Switching Costs
5. Regulatory Barriers, Patents & Licensing | Terminal Value & Market Share: Low entry barriers invite fresh venture/PE capital, compressing long-term terminal multiples. |
| F3. Bargaining Power of Suppliers | 1. Supplier Concentration vs. Industry Concentration
2. Availability of Substitute Inputs
3. Switching Costs for Core Inputs/Vendors
4. Threat of Forward Vertical Integration
5. Input Criticality to Final Product Quality | COGS & Working Capital (DPO): Powerful suppliers extract margin via price hikes (higher COGS) and tighter payment terms. |
| F4. Bargaining Power of Buyers | 1. Buyer Revenue Concentration (Top 5 %)
2. Purchase Volume Relative to Vendor Revenue
3. Buyer Switching Costs (Vendor Lock-in)
4. Threat of Backward Vertical Integration
5. Price Sensitivity & Information Transparency | Net Revenue, Churn & DSO: Powerful buyers demand volume discounts, extend payment terms (DSO), and elevate churn risk. |
| F5. Threat of Substitutes | 1. Relative Price-Performance Ratio of Substitutes
2. Buyer Propensity to Substitute
3. Buyer Switching Costs to Alternative Tech
4. Cross-Price Elasticity of Demand
5. Pace of Disruptive Technological Obsolescence | Pricing Ceiling & R&D CAPEX: Substitutes cap maximum pricing power and force defensive R&D reinvestment to avoid obsolescence. |
To convert these 25 qualitative dimensions into a rigorous C-Suite decision engine, we construct a two-stage stochastic weighting model.
Stage 1: Within-Force Subfactor Normalization & Scoring
Let F_k denote each of the five competitive forces, where k ∈ {1, 2, 3, 4, 5}. Within each force k, we evaluate n = 5 structural subfactors f_(k,i) (for i = 1, ..., 5).
- Intra-Force Relative Weight (w_(k,i)): We assign each subfactor a weight reflecting its structural importance within that specific force, subject to the unit-sum normalization constraint:
w(k,i) ∈ [0, 1] such that Σ(i=1..5) w_(k,i) = 1.00 (∀ k ∈ {1, ..., 5})
Empirical Pressure Rating (c_(k,i)): Each subfactor is scored on a continuous or discrete scale c_(k,i) ∈ [1.0, 5.0] anchored to verifiable market data, where 1.0 represents minimal structural pressure (highly favorable for the incumbent) and 5.0 represents extreme structural pressure (value-destroying for the incumbent):
- Score 1.0 (Very Low Threat / High Protection): E.g., Buyer concentration < 5% of revenue; proprietary patent protection > 10 years; high switching costs (> 25% of annual contract value).
- Score 3.0 (Moderate / Neutral Equilibrium): E.g., Industry growing in line with GDP (2–4%); moderate switching costs; balanced supplier base.
- Score 5.0 (Critical Threat / Severe Margin Erosion): E.g., Top 3 customers represent > 50% of revenue; zero switching costs; disruptive AI substitute offering 10× performance at 30% of the price.
Weighted Force Intensity Score (F_k): The structural pressure exerted by force k is the inner product of its weight vector and rating vector:
Fk = Σ(i=1..5) ( w(k,i) · c(k,i) ) ∈ [1.00, 5.00]
Stage 2: Macro-Industry Asymmetric Weighting & Consolidated Indices
Crucially, the five forces do not carry equal weight across all sectors (a uniform 20% / 20% / 20% / 20% / 20% weighting is only a baseline special case). We define a macro-industry weight vector W = [W_1, W_2, W_3, W_4, W_5] satisfying:
Wk ∈ [0, 1] such that Σ(k=1..5) W_k = 1.00
- Example (B2B Enterprise SaaS): High weighting on Threat of Substitutes/AI (W_5 = 0.25) and Competitive Rivalry (W_1 = 0.25), lower weighting on Physical Supplier Power (W_3 = 0.15).
- Example (Automotive Tier-2 Manufacturing): High weighting on Buyer Power / OEMs (W_4 = 0.30) and Supplier Power / Raw Materials (W_3 = 0.25).
From this second aggregation stage, we derive two master executive metrics:
1. Consolidated Competitive Intensity Index (I_comp)
Measures the aggregate structural pressure exerted by the industry ecosystem against the firm's margins:
Icomp = Σ(k=1..5) ( W_k · Fk ) = Σ(k=1..5) Wk · [ Σ(i=1..5) ( w(k,i) · c(k,i) ) ] ∈ [1.00, 5.00]
2. Industry Attractiveness Index (A_ind)
To provide the Board with an intuitive positive scale where higher values indicate superior structural profitability potential, we define the Scalar Attractiveness Index (A_ind ∈ [0.00, 4.00]) and its Normalized Percentage Equivalent (A_ind(%) ∈ [0%, 100%]):
A_ind = 5.00 − I_comp ∈ [0.00, 4.00]
A_ind(%) = ( (5.00 − I_comp) / 4.00 ) × 100%
C-Suite Interpretation Table: Mapping Porter Scores to Financial Spreads (ROIC − WACC)
Competitive Intensity (I_comp) | Attractiveness Index (A_ind) | Attractiveness (A_ind %) | Structural Regime | Expected Financial Spread (ROIC − WACC) | C-Suite Capital Allocation Mandate |
|---|
| 1.00 – 1.80 | 3.20 – 4.00 | 80% – 100% | Structural Oligopoly / High Moat | +8.0% to +15.0%+ | Aggressive Expansion: Maximize organic CAPEX, M&A roll-ups, and capacity lock-in. |
| 1.81 – 2.60 | 2.40 – 3.19 | 60% – 79% | Attractive / Differentiated Market | +3.0% to +7.9% | Selective Growth: Invest in product differentiation, contractual lock-in, and R&D moats. |
| 2.61 – 3.40 | 1.60 – 2.39 | 40% – 59% | Contested / Margin-Compressed | −1.0% to +2.9% | Defensive Restructuring: Freeze non-core CAPEX; shift OPEX toward switching-cost creation. |
| 3.41 – 4.20 | 0.80 – 1.59 | 20% – 39% | Hyper-Competitive / Commoditized | −5.0% to −1.1% | Consolidation or Niche Pivot: Harvest cash flow, automate cost structure, or pivot to high-margin micro-verticals. |
| 4.21 – 5.00 | 0.00 – 0.79 | 0% – 19% | Structural Value Destruction | < −5.0% | Divestiture / Exit: Halt new capital deployment; execute orderly divestment or asset liquidation. |
3. Visual Architecture: Dynamic Radar & The 2D Economic Moat Matrix
Numbers in a table rarely persuade a time-constrained Board of Directors on their own. The quantitative output must be translated into two high-density visual artifacts:
1. The Pentagonal Structural Pressure Radar (Current vs. Post-Mitigation Target)
By plotting [F_1, F_2, F_3, F_4, F_5] on a 5-axis radar chart alongside the Sector Benchmark and the 12-Month Post-CAPEX Target, executives immediately identify which structural axis is deforming the company's P&L. Instead of debating abstract opinions, the Board sees visually whether margin compression stems from Buyer Concentration (F4 > 4.0) or Technological Substitution (F5 > 3.8).
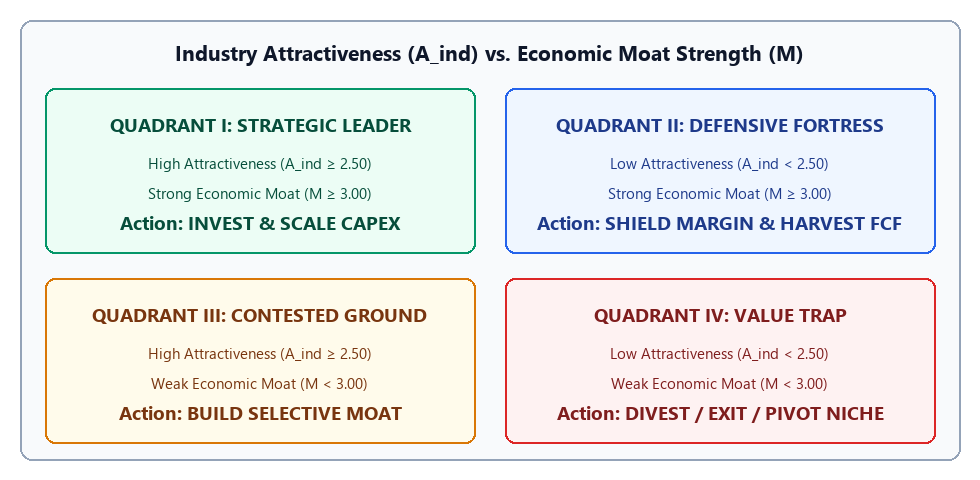
2. The 2D Cartesian Matrix: Industry Attractiveness vs. Internal Economic Moat
An unattractive industry (A_ind < 2.0) does not automatically condemn a company to bankruptcy—provided the firm possesses a superior Internal Economic Moat (as popularized by Warren Buffett and formalized by Morningstar/McKinsey). Conversely, a highly attractive industry (A_ind > 3.0) can still result in failure if the company lacks competitive advantage.
To capture this duality, we evaluate the company's Internal Moat Score (M ∈ [1.0, 5.0]) across five proprietary dimensions (Switching Costs, Network Effects, Intangible Assets/IP, Cost Advantage via Scale, and Execution Velocity) and cross-plot (A_ind, M) on a 2D Cartesian plane:
4. Complete Case Study: B2B Industrial Software & Telemetry (TechMotion Solutions)
To demonstrate how this mathematical engine operates in a real-world boardroom scenario, let us examine TechMotion Solutions, a mid-market B2B provider of industrial telemetry software and edge hardware with $45.0M in annual revenue, an EBITDA margin of 18.5% ($8.32M), and a concerning trend: gross margins have contracted by 320 basis points over the past 18 months.
Step 1: Empirical Audit & Dual-Weighted Scoring
During the quarterly strategy offsite, the executive team (CEO, CFO, VP of Sales, CTO) audits the 25 subfactors using CRM, ERP, and procurement data:
- Buyer Power (F4) is critical: The top 5 enterprise accounts represent 52% of annual recurring revenue, and procurement departments are threatening to switch to lower-cost alternatives unless TechMotion grants a 12% price reduction upon renewal.
- Threat of Substitutes (F5) is accelerating: Cloud-native AI automation platforms are offering predictive maintenance modules that bypass traditional telemetry hardware at 40% lower total cost of ownership (TCO).
Applying the industry macro-weights W_k and intra-force weights w_(k,i) yields the following consolidated scorecard:
Competitive Force (k) | Macro Weight (W_k) | Weighted Force Score (F_k) | Weighted Contribution (W_k · F_k) | Primary Empirical Driver Identified |
|---|
| F1. Competitive Rivalry | 25.0% | 3.60 / 5.0 | 0.900 | 4 direct competitors discounting setup fees by 30% to capture market share. |
| F2. Threat of New Entrants | 15.0% | 2.40 / 5.0 | 0.360 | Moderate protection due to ISO industrial certifications and hardware integration. |
| F3. Supplier Power | 15.0% | 2.90 / 5.0 | 0.435 | Dependency on 2 specialized semiconductor/sensor OEMs with 16-week lead times. |
| F4. Buyer Power | 25.0% | 4.10 / 5.0 | 1.025 | Critical: Top 5 clients = 52% of revenue; low API lock-in allows easy migration. |
| F5. Threat of Substitutes | 20.0% | 3.50 / 5.0 | 0.700 | High: AI-driven hardware-agnostic SaaS substitutes eroding legacy license value. |
| CONSOLIDATED TOTAL | 100.0% | I_comp = 3.42 | 3.420 / 5.0 | Industry Attractiveness Index A_ind = 5.00 − 3.42 = 1.58 / 4.00 (39.5%) |
Step 2: Financial Diagnosis & P&L Stress Test
With I_comp = 3.42 and A_ind = 1.58 (39.5%), TechMotion sits on the boundary between a Contested Market and a Hyper-Competitive Commoditized Regime.
- If the Board takes no structural action, financial modeling projects that buyer price concessions (F4) and churn to AI substitutes (F5) will compress the EBITDA margin from 18.5% to 14.0% (-450 bps) within 24 months, destroying $3.15M in annual Free Cash Flow and wiping out over $25M in enterprise valuation (at an 8× EV/EBITDA multiple).
Step 3: The C-Suite Counter-Offensive (CAPEX/OPEX Moat Roadmap)
Rather than approving across-the-board commercial discounts (which permanently destroy EBITDA), the CFO and CTO use the Porter model to design a targeted $915,000 Moat Construction Program ($675k CAPEX + $240k OPEX) aimed strictly at neutralizing F4 (Buyer Power) and F5 (Substitutes):
| Strategic Initiative | Target Force | Capital Allocation (CAPEX / OPEX) | Structural Mechanism (Moat Creation) | Target Force Score (12M) | Projected EBITDA Protection |
|---|
| 1. Native ERP/MES Bidirectional Connectors | F4 (Buyers) | $325k CAPEX
$80k OPEX | Deeply embeds telemetry data into client SAP/Oracle workflows, raising customer switching costs by 400%. | 4.10 → 2.90 | +210 bps
(Halts 12% price erosion) |
| 2. Embedded Predictive AI Module (Co-Pilot) | F5 (Substitutes) | $350k CAPEX
$110k OPEX | Neutralizes external SaaS substitutes by bundling automated anomaly detection natively into existing contracts. | 3.50 → 2.50 | +180 bps
(Reduces churn by 6.5%) |
| 3. Multi-Year Tiered Enterprise MSA Program | F1 & F4 | $0k CAPEX
$50k OPEX | Replaces annual renewals with 3-year Master Service Agreements linked to SLA performance credits rather than price cuts. | 3.60 → 3.10 | +90 bps
(Stabilizes net retention) |
| TOTAL / NET IMPACT | All Forces | $675k CAPEX
$240k OPEX | I_comp drops from 3.42 to 2.81
Attractiveness A_ind rises from 1.58 to 2.19 (+38.6%) | 2.81 / 5.0 | +480 bps Defended
($2.16M/yr EBITDA saved) |
Boardroom Decision Outcome: By investing $915k in structural switching costs and product moat architecture, TechMotion defends an 18.8% EBITDA margin (vs. the 14.0% inaction baseline), generating a payback period of 13.8 months and an incremental ROIC of 28.4%.
5. Common Pitfalls & Best Practices in Quantitative Industry Analysis
When deploying this framework across corporate strategy teams or consulting engagements, enforce these four governance rules:
- Define the Industry Boundary with Surgical Precision (NAICS / Segment Level): Never run a Porter analysis on a macro-label like "Technology" or "Healthcare". Analyze a specific competitive arena (e.g., "B2B Cold-Chain Logistics Telemetry in Western Europe"). Moving from a broad sector to a focused vertical often shifts A_ind by more than ±1.20 points.
- Enforce Evidence-Based Scoring Audits: Forbid executives from voting on scores (c_(k,i)) via show of hands. Every score of 4.0 or 5.0 must cite an empirical metric in the model's audit column (e.g., "CR4 = 78%", "Top 3 clients = 48% of ARR", "Gross margin down 280 bps YoY").
- Run Sensitivity Analysis (±15% Weight Perturbation): Before committing millones in CAPEX, verify that your strategic conclusion does not flip if macro-weights W_k vary by ±15%. A robust strategy remains valid across plausible weight distributions.
- Re-evaluate Dynamically Every 6–12 Months: Industry structure is not static. Regulatory shifts, M&A consolidation, or generative AI breakthroughs can alter F2 and F5 within two quarters.
📊 Executive Kit: Weighted Porter's 5 Forces & Industry Attractiveness (Excel + PPTX)
Want to skip building the mathematical engine and Minto Pyramid slides from scratch? You can explore and download the complete Executive Kit: Weighted Porter's 5 Forces & Industry Attractiveness Matrix (automated Excel workbook with 25 pre-calibrated subfactors, dynamic radar chart, 2D Moat Matrix, CAPEX/OPEX roadmap, plus a McKinsey/BCG-grade PowerPoint boardroom deck) directly in our resource library:
👉 Explore the Executive Templates & Quantitative Toolkits at Datalaria Resources
If you found this quantitative framework useful, explore more executive engineering and corporate strategy articles at www.datalaria.com.