In earlier installments, we engineered the foundational backbone of LifeOps: in Part 1 we designed the polymorphic PostgreSQL schema and modular FastAPI backend, and in Part 2 we brought the Glassmorphism Dark Mode design system and global 360° Dashboard to life.
Now comes the most defining phase of development: the day-to-day functional modules.
A personal operating system fails if it forces users into rigid input forms or scatters daily data across disconnected views. The challenge was articulating three completely disparate life areas under unified design and performance standards:
- 🏃 Health & Physical Fitness: Workout logging across sports with dynamic metrics (distance volume, calories, pace calculations, and Personal Bests).
- 📚 Intellectual Culture & Media: Book tracking with interactive reading progress bars and an entertainment catalog organized by streaming platform.
- 💼 Professional Execution: An agile 4-column Kanban board mapped to projects, equipped with a chronological progress log powered by PostgreSQL JSONB.
[!TIP]
Test the live app: You can explore the production build of LifeOps directly at https://datalaria.com/apps/lifeops/.
🗺️ LifeOps Series Roadmap
To understand how every architectural layer fits together, this series spans 5 structured installments:
- 🟢 Part 1: Personal Operating System Architecture and FastAPI + Supabase Backend
- 🟢 Part 2: React Frontend with Glassmorphism, 360° Dashboard, and Design System
- 🟢 Part 3 (This article): Core Interactive Modules: Fitness, Library, Cinema, and Professional Kanban Board
- ⚪ Part 4: In-Memory Word Dossiers (.docx) & Multi-Sheet Excel Engine (.xlsx)
- ⚪ Part 5: 24/7 Zero-Cost Cloud Deployment ($0/month), Mobile UX, and PWA
1. The UX Dilemma: Dual View Mode (Inspiring Cards vs. Synthesized Table) 🎴📊
When building data-intensive dashboards, designers face a classic user experience tradeoff:
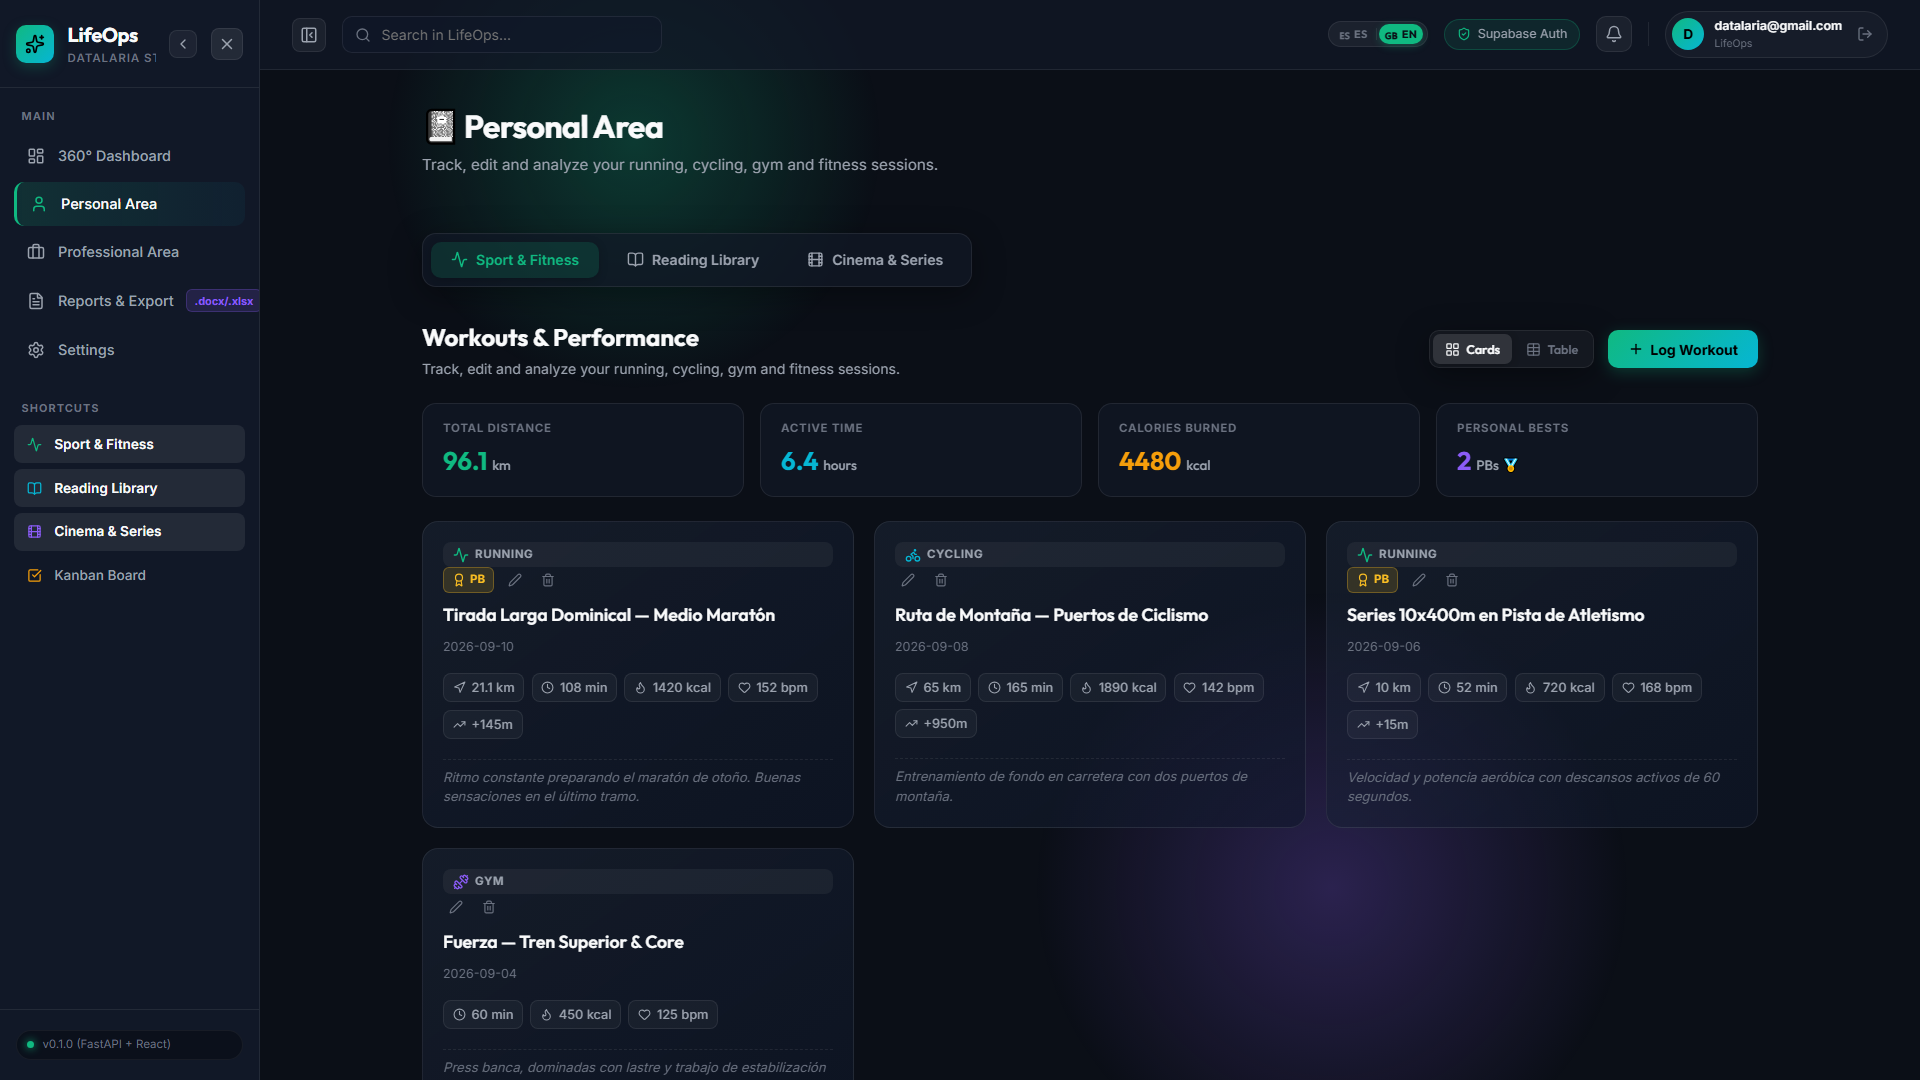
- The Grid / Cards View: Visually engaging, spacious, and inspiring. It highlights book covers, movie posters, and workout chips at a glance.
- The Data Table View: Irreplaceable when auditing timestamps, comparing heart rates, or scanning through an entire month of logs without endless vertical scrolling.
Instead of forcing a single opinionated view, I built a persistent dual-mode toggle stored in localStorage:
const [viewMode, setViewMode] = useState(() => {
  return localStorage.getItem('lifeops_view_sport') || 'grid';
});

const handleViewChange = (mode) => {
  setViewMode(mode);
  localStorage.setItem('lifeops_view_sport', mode);
};
In the header of each module, two unobtrusive buttons with LayoutGrid and Table icons toggle the presentation mode instantly. Thanks to React and Vite's build architecture, view switches execute in sub-milliseconds without triggering redundant server roundtrips.
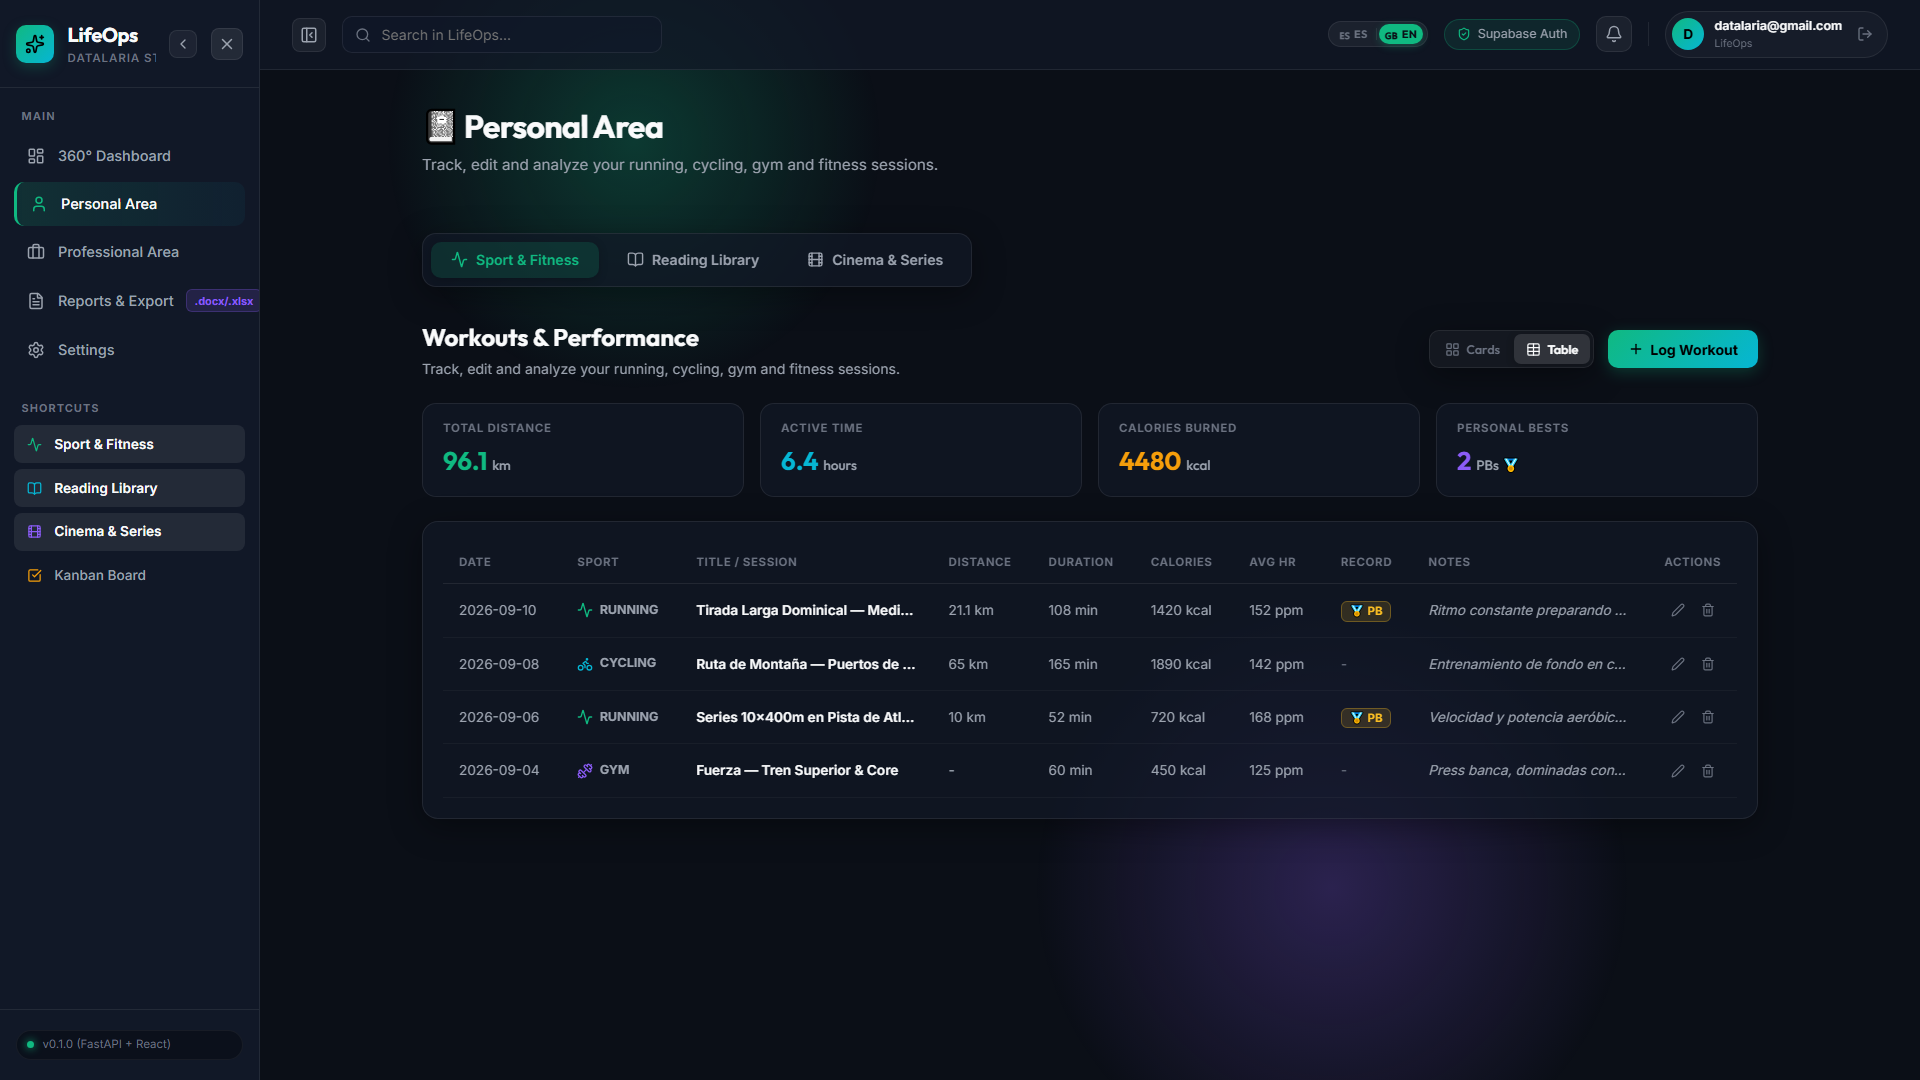
The fitness module caters to multi-sport athletes practicing running, road cycling, gym strength sessions, and swimming.
┌────────────────────────────────────────────────────────────────────────┐
│  🏃 Sport & Fitness                    [ + Log Workout ]       [⊞|≡]   │
├─────────────────┬─────────────────┬─────────────────┬──────────────────┤
│ TOTAL DISTANCE  │ ACTIVE TIME     │ CALORIES        │ PERSONAL BESTS   │
│   142.5 km      │   18.4 hours    │   12,450 kcal   │    4 PBs 🏅      │
├─────────────────┴─────────────────┴─────────────────┴──────────────────┤
│                                                                        │
│ ┌───────────────────────────┐         ┌──────────────────────────────┐ │
│ │ 🏃 RUNNING         🏅 PB  │         │ 🚴 CYCLING                   │ │
│ │ Sunday Long Run           │         │ Mountain Pass Century Ride   │ │
│ │ 2026-09-10                │         │ 2026-09-08                   │ │
│ │ [📍 21.1 km] [⏱️ 1h 48m]  │         │ [📍 65.0 km] [⏱️ 2h 45m]     │ │
│ │ [🔥 1,420 kcal] [❤️ 152bpm]│        │ [🔥 1,890 kcal] [⛰️ +950m]    │ │
│ └───────────────────────────┘         └──────────────────────────────┘ │
└────────────────────────────────────────────────────────────────────────┘
2.1. Aggregated High-Level KPIs
Before rendering individual activity items, we compute cumulative totals using in-memory array reducers:
const totalKm = workouts.reduce((sum, act) => sum + (act.workout?.distance_km || 0), 0);
const totalMinutes = workouts.reduce((sum, act) => sum + (act.duration_minutes || 0), 0);
const totalCalories = workouts.reduce((sum, act) => sum + (act.workout?.calories || 0), 0);
const pbCount = workouts.filter((act) => act.workout?.personal_best).length;
2.2. Segregated FastAPI Payload
When an athlete records an exercise, the client dispatches a structured contract that FastAPI parses into the master table lifeops.activities and the child table lifeops.workouts:
const payload = {
  activity: {
    activity_type: 'sport',
    title: formData.title,
    date: formData.date,
    duration_minutes: parseInt(formData.duration_minutes),
    description: formData.notes,
  },
  workout: {
    workout_type: formData.workout_type, // 'running' | 'cycling' | 'gym'
    distance_km: parseFloat(formData.distance_km) || null,
    calories: parseInt(formData.calories) || null,
    avg_heart_rate: parseInt(formData.avg_heart_rate) || null,
    elevation_m: parseInt(formData.elevation_m) || null,
    personal_best: formData.personal_best,
    notes: formData.notes,
  },
};
This ensures shared attributes (dates, general durations, notes) remain globally indexable for the 360° Dashboard, while biometric attributes (elevation gain, heart rate, personal bests) reside in their specialized child table with cascading foreign key guarantees.
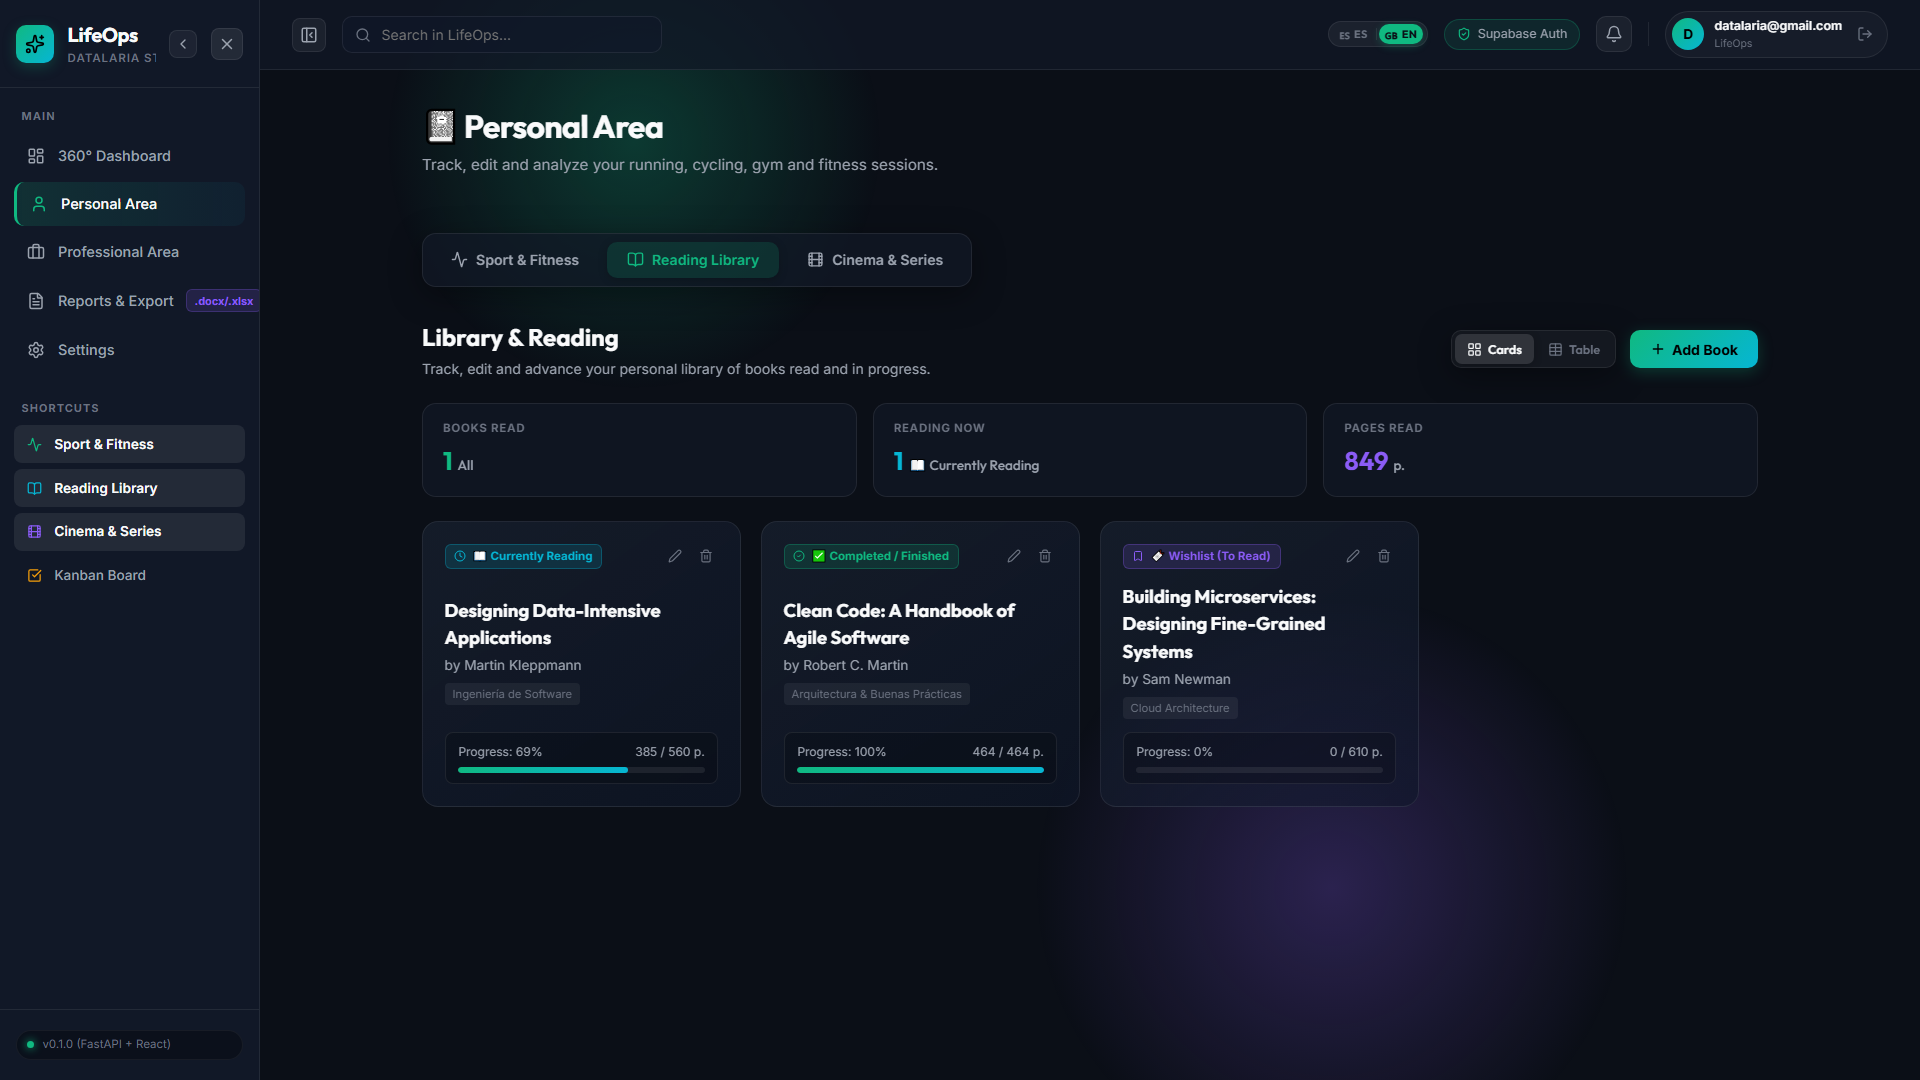
For cultural tracking, the goal was leaving behind fragmented mobile notes in favor of an enriched visual library.
3.1. Interactive Reading Progress (BooksModule.jsx)
On each book card, we calculate page completion percentages in real time:
const percentage = b.pages_total > 0
  ? Math.min(100, Math.round((b.pages_read / b.pages_total) * 100))
  : 0;

<div className="book-progress-wrapper">
  <div className="progress-info">
    <span>{b.pages_read} / {b.pages_total} pages</span>
    <span className="percentage-tag">{percentage}%</span>
  </div>
  <div className="progress-bar-bg">
    <div
      className="progress-bar-fill"
      style={{
        width: `${percentage}%`,
        background: percentage === 100 ? 'var(--accent-emerald)' : 'var(--grad-primary)'
      }}
    />
  </div>
</div>
A status filter organizes titles into reading, completed, and wishlist, paired with an interactive 5-star rating system using lucide-react icons.
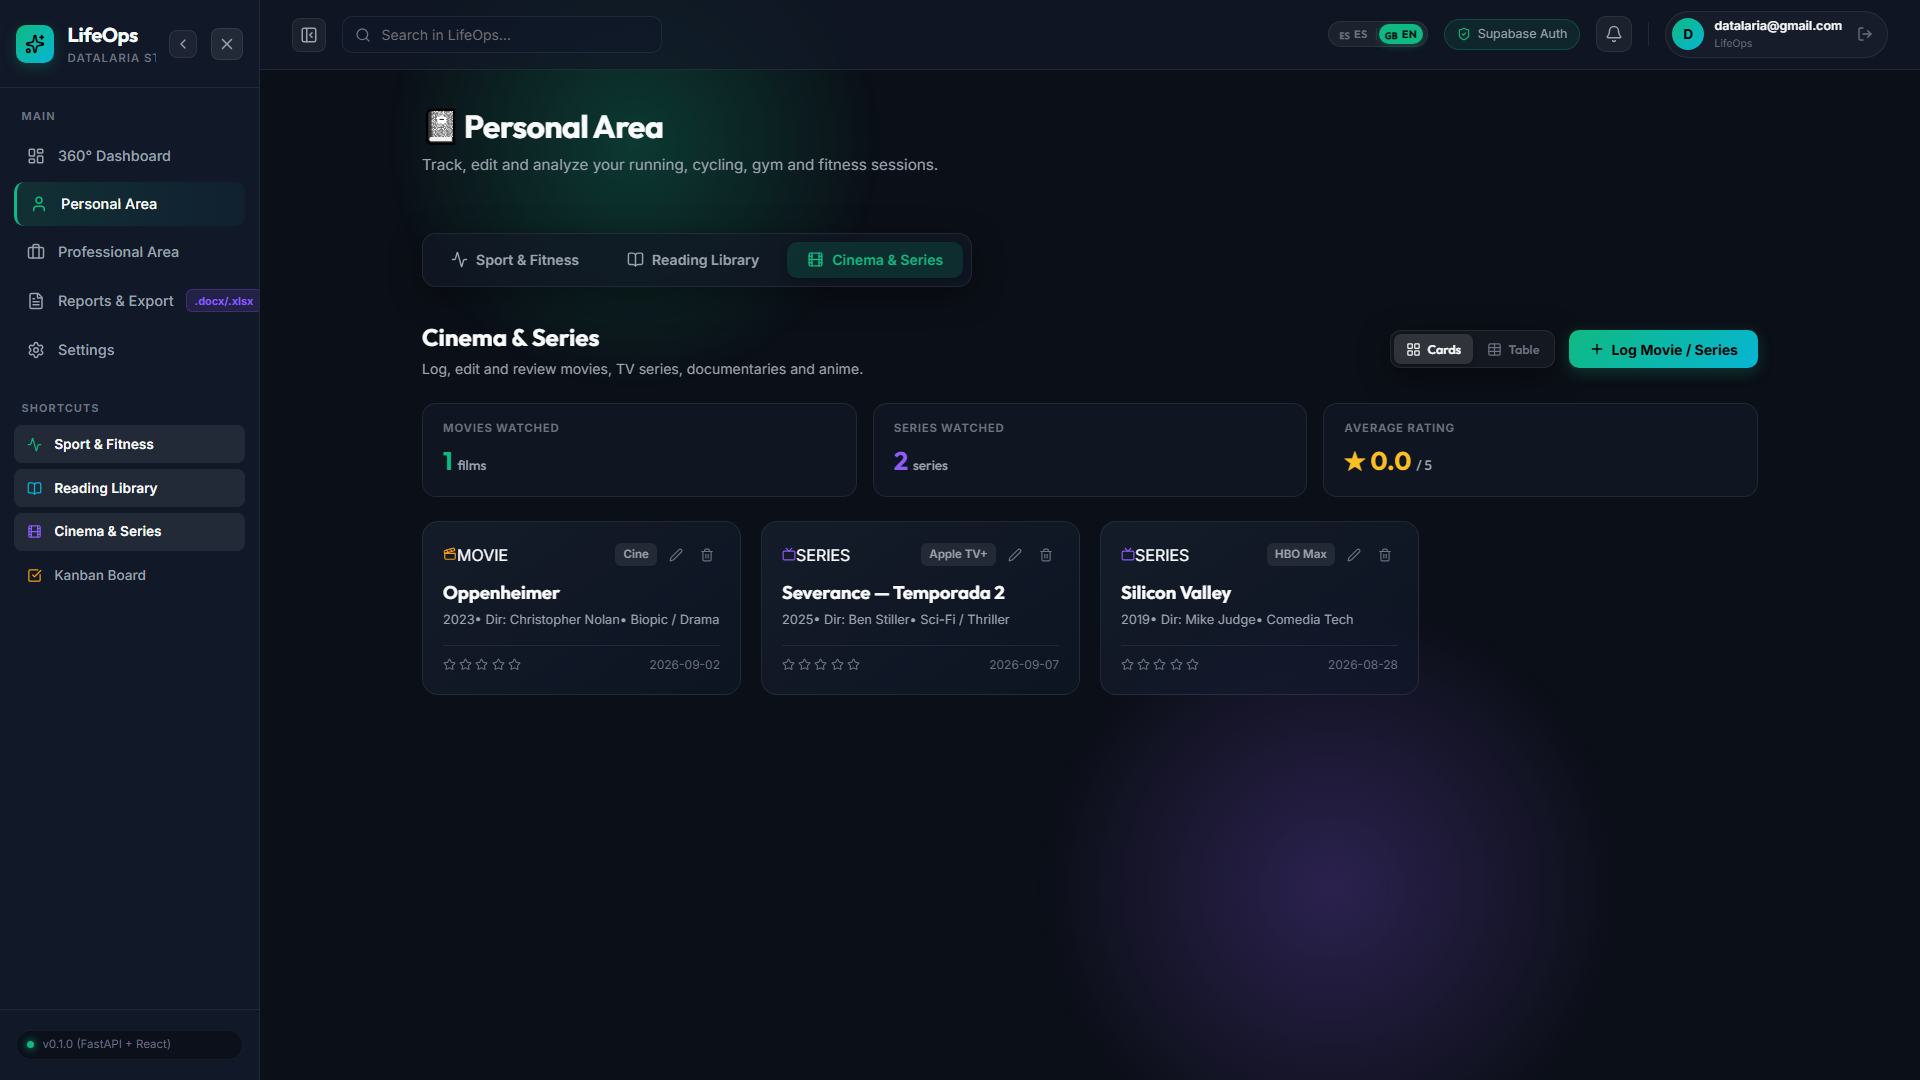
The cinema module tracks movies, TV series, and documentaries cataloged by streaming provider (Netflix, HBO Max, Prime Video, Disney+, Cinema). Each entry logs release year, director, rating, and personal review notes, answering: "What were the best films I watched this past quarter?".
4. Professional Execution: The Kanban Board (KanbanBoard.jsx) 📋
For professional tasks, I implemented a full Kanban board featuring 4 columns reflecting agile task lifecycles:
- 📝 To Do (
todo): Backlog tasks queued for upcoming execution.
- ⚡ In Progress (
in_progress): Active work during the current sprint.
- 🔍 In Review (
review): Tasks pending review, testing, or third-party feedback.
- ✅ Done (
done): Completed deliverables.
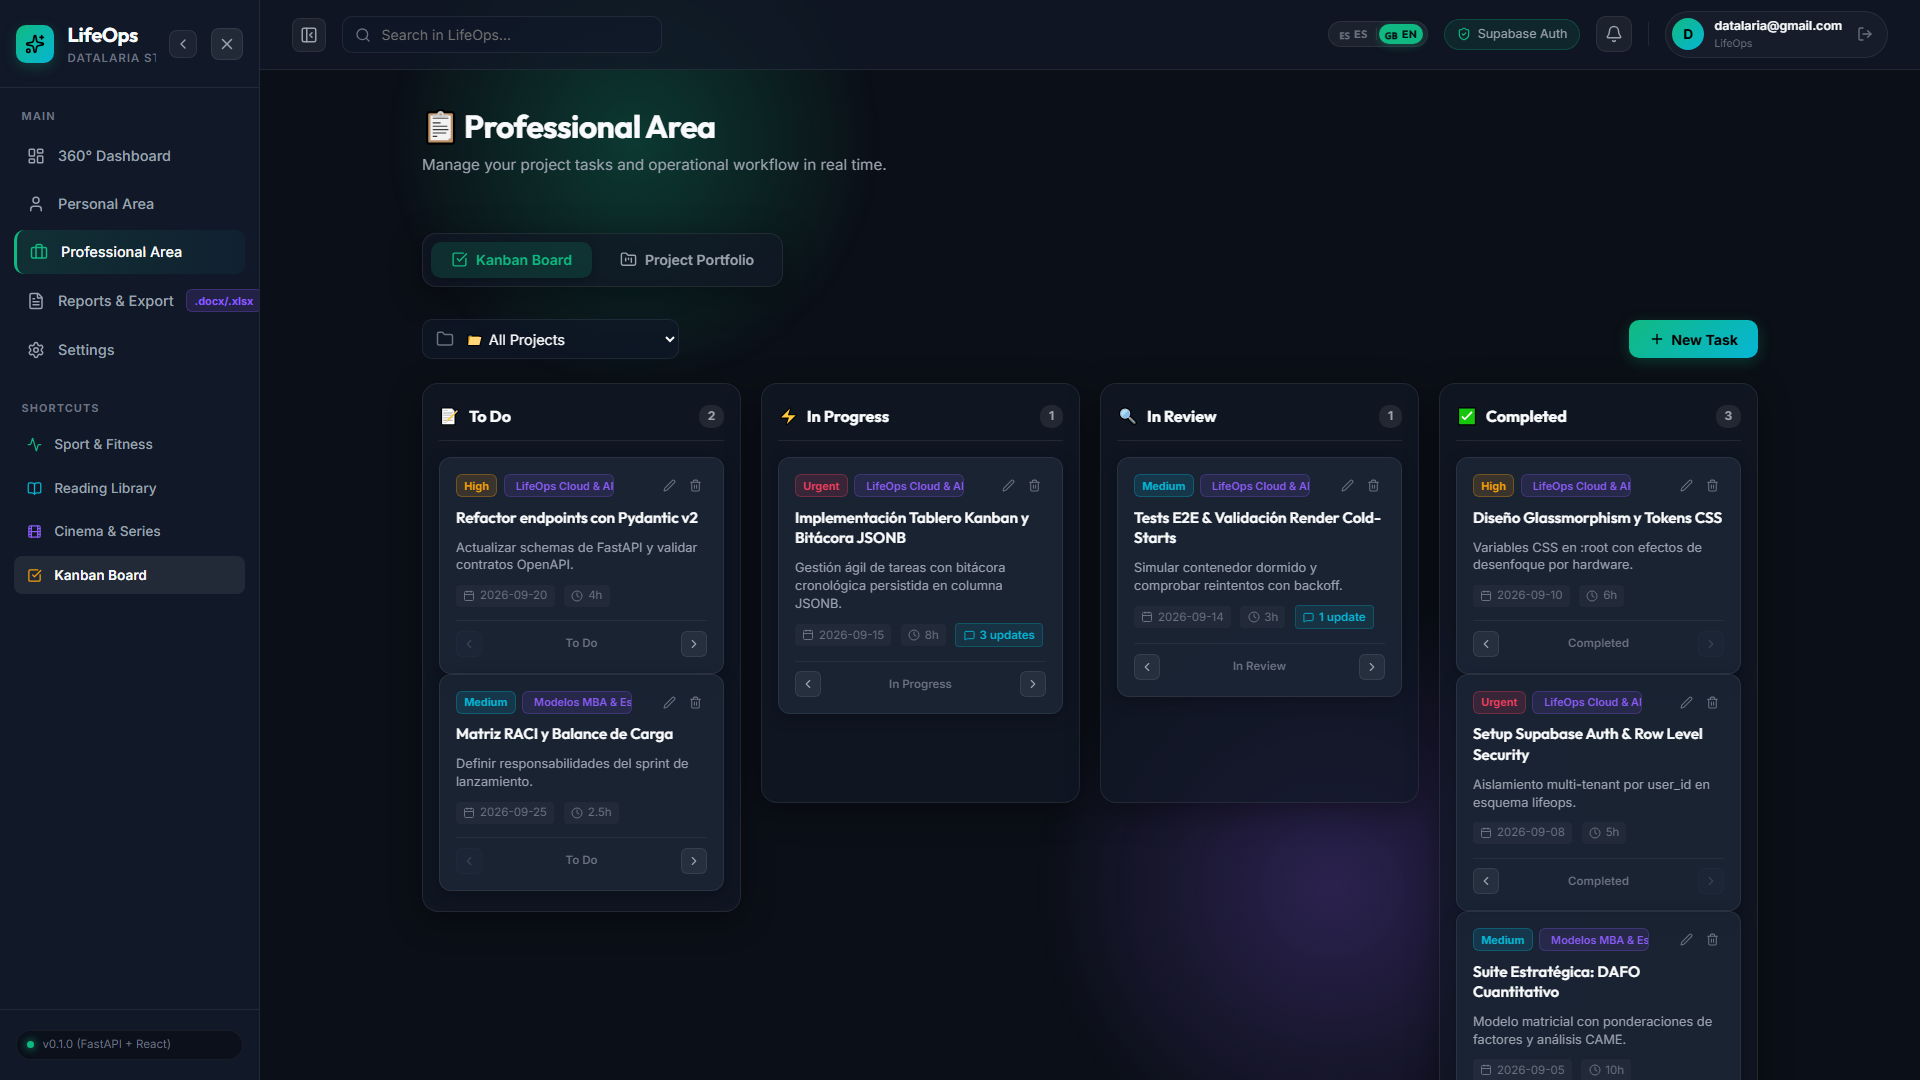
┌──────────────────┬──────────────────┬──────────────────┬──────────────────┐
│ 📝 TO DO (3)     │ ⚡ IN PROGRESS (2)│ 🔍 IN REVIEW (1) │ ✅ DONE (8)      │
├──────────────────┼──────────────────┼──────────────────┼──────────────────┤
│ ┌──────────────┐ │ ┌──────────────┐ │ ┌──────────────┐ │ ┌──────────────┐ │
│ │ Refactor API │ │ │ Frontend UI  │ │ │ E2E Test Run │ │ │ DB Migration │ │
│ │ 🚨 Critical  │ │ │ 🟡 Medium    │ │ │ 🟢 Low       │ │ │ 2026-09-02   │ │
│ │ 📅 Sep 18    │ │ │ 💬 3 notes   │ │ │ 📅 Today     │ │ │ 💬 5 notes   │ │
│ │ [→ Move]     │ │ │ [←]      [→] │ │ │ [←]      [→] │ │ │ [← Move]     │ │
│ └──────────────┘ │ └──────────────┘ │ └──────────────┘ │ └──────────────┘ │
└──────────────────┴──────────────────┴──────────────────┴──────────────────┘
4.1. Optimistic UI Updates for Tactile Fluidity
When moving a task from in_progress to review, waiting for the entire roundtrip (browser → Render API → Supabase → response) introduces an undesirable delay of several hundred milliseconds.
To deliver an instantaneous tactile feel, we execute an optimistic state update in React:
const handleMoveTask = async (taskId, currentStatus, direction) => {
  const statusOrder = ['todo', 'in_progress', 'review', 'done'];
  const currentIndex = statusOrder.indexOf(currentStatus);
  const targetIndex = direction === 'next' ? currentIndex + 1 : currentIndex - 1;

  if (targetIndex < 0 || targetIndex >= statusOrder.length) return;
  const targetStatus = statusOrder[targetIndex];

  // 1. Instantaneous optimistic update