The support ticket says "the assistant took forever and then gave up." You open your logs. There's a line that says calling model..., a line eleven seconds later that says done, and somewhere in between, three tool calls that logged nothing because they succeeded. The invoice at the end of the month says €4,180 and you cannot tell which feature spent it.
This is the normal state of an LLM application, and it's not because the team was lazy. It's because everyone instruments these things ad hoc — a logger.info here, a token counter bolted onto a wrapper there, a Grafana panel that measures the one thing somebody happened to care about in March. Six months later you have telemetry that only its author can read, and no way to compare last week to this week.
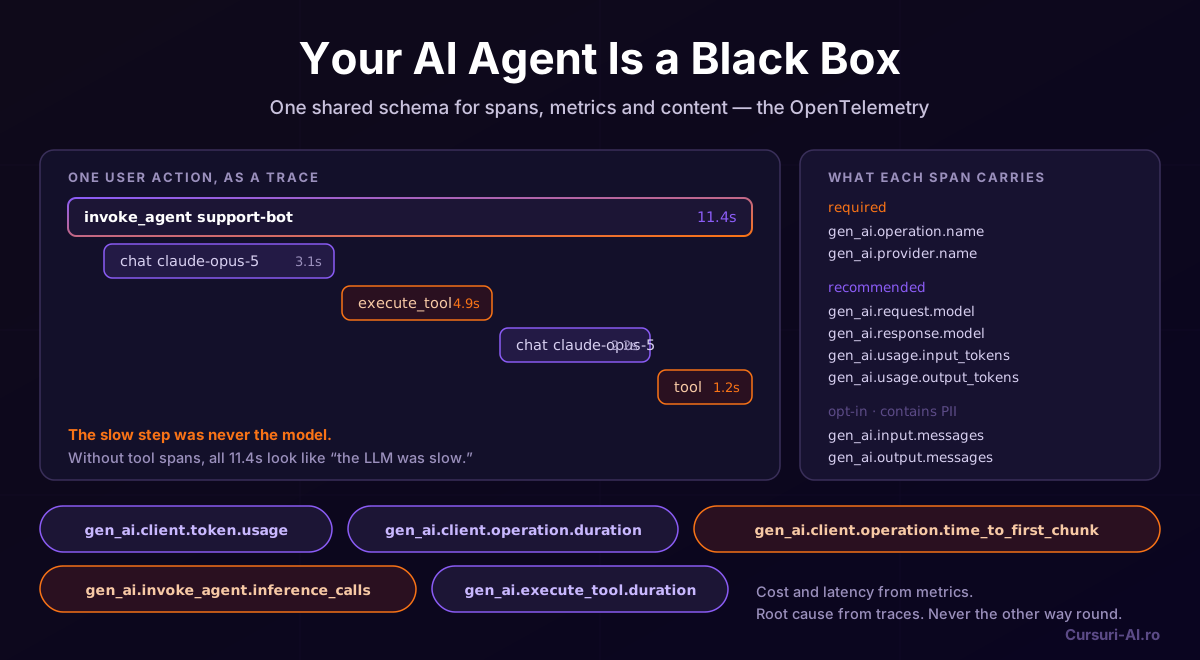
The OpenTelemetry GenAI semantic conventions are the fix: an agreed-upon schema for what an LLM call, a tool execution and an agent invocation look like as telemetry. Not a vendor SDK, not a platform — a naming convention that any backend can consume. This article is how to actually use it: the spans, the metrics, the content-capture question, working Python, and an honest account of the parts that will change under you.
Why LLM apps break normal observability
Three properties make a model call unlike the HTTP calls your existing instrumentation was designed for.
Every call costs money, and the cost is variable. A database query is either fast or slow. A model call is fast or slow and cheap or expensive, and the two aren't correlated — a short, quick response to a 90,000-token context is your most expensive request of the day. Latency dashboards will never show you that. You need token counts as first-class telemetry, dimensioned the same way your latency is.
Failure is often silent. A 200 OK containing a hallucinated answer, a truncated response that hit max_tokens, a tool call the model decided to skip — none of these raise. Your error rate stays at 0.0% while the feature is broken.
A single user action is a tree, not a call. One "summarise this and file a ticket" fans out into an agent invocation, three inference calls, two tool executions and a retry. Averages across that tree are meaningless. You need the tree.
Distributed tracing already solves the third problem, and it has for a decade. The GenAI conventions extend it to cover the first two.
The conventions in one screen
Everything lives under the gen_ai.* namespace, and it decomposes into three signals:
- Spans — one per operation. An inference span for a model call, plus agent-framework spans:
invoke_agent, create_agent, execute_tool, invoke_workflow, plan.
- Metrics — pre-aggregated histograms for token usage, operation duration and streaming latency, so you're not computing cost by scanning traces.
- Events — the prompt and completion content, opt-in, because it's PII.
For the inference span, the naming rule is {gen_ai.operation.name} {gen_ai.request.model} — so chat claude-opus-5, not anthropic_call or llm. Two attributes are Required:
| Attribute | Example |
|---|
gen_ai.operation.name | chat, embeddings, generate_content, text_completion, execute_tool, invoke_agent |
gen_ai.provider.name | anthropic, openai, gcp.gemini, aws.bedrock |
Then a set that's Conditionally Required when it applies — gen_ai.request.model, gen_ai.conversation.id, gen_ai.output.type, gen_ai.request.choice.count (when it isn't 1), gen_ai.request.stream, gen_ai.request.seed, error.type — and a Recommended set that carries most of the analytical value: gen_ai.request.temperature, gen_ai.request.top_p, gen_ai.request.max_tokens, gen_ai.usage.input_tokens, gen_ai.usage.output_tokens, gen_ai.response.id, server.address.
That's the whole contract. If you emit those, any conforming backend can chart your LLM traffic without you writing a single custom query.
Instrumenting a call by hand
Auto-instrumentation exists (we'll get to it), but writing one span manually is the fastest way to understand what the libraries are doing — and you'll need it anyway for anything the libraries don't cover.
import time
from opentelemetry import trace, metrics

tracer = trace.get_tracer("myapp.llm")
meter = metrics.get_meter("myapp.llm")

token_usage = meter.create_histogram(
    "gen_ai.client.token.usage",
    unit="{token}",
    description="Number of input and output tokens used.",
)
op_duration = meter.create_histogram(
    "gen_ai.client.operation.duration",
    unit="s",
    description="GenAI operation duration.",
)

PROVIDER = "anthropic"


def chat(client, model: str, messages: list, max_tokens: int = 1024):
    base = {
        "gen_ai.operation.name": "chat",
        "gen_ai.provider.name": PROVIDER,
        "gen_ai.request.model": model,
    }
    started = time.perf_counter()

    with tracer.start_as_current_span(
        f"chat {model}",
        kind=trace.SpanKind.CLIENT,
        attributes={**base, "gen_ai.request.max_tokens": max_tokens},
    ) as span:
        try:
            resp = client.messages.create(
                model=model, max_tokens=max_tokens, messages=messages
            )
        except Exception as exc:
            error_type = type(exc).__qualname__
            span.set_attribute("error.type", error_type)
            span.set_status(trace.StatusCode.ERROR, str(exc))
            op_duration.record(
                time.perf_counter() - started, {**base, "error.type": error_type}
            )
            raise

        span.set_attributes({
            "gen_ai.response.id": resp.id,
            "gen_ai.response.model": resp.model,
            "gen_ai.response.finish_reasons": [resp.stop_reason],
            "gen_ai.usage.input_tokens": resp.usage.input_tokens,
            "gen_ai.usage.output_tokens": resp.usage.output_tokens,
        })

        token_usage.record(resp.usage.input_tokens, {**base, "gen_ai.token.type": "input"})
        token_usage.record(resp.usage.output_tokens, {**base, "gen_ai.token.type": "output"})
        op_duration.record(time.perf_counter() - started, base)

        return resp
Three details in there that people get wrong:
Both request and response model. gen_ai.request.model is what you asked for; gen_ai.response.model is what answered. If you use an alias or a routing layer, these diverge, and the day they diverge unexpectedly is the day you want the data.
error.type goes on the metric too, not just the span. Otherwise your duration histogram silently mixes successful 4-second calls with timeouts that died at 60, and your p95 becomes fiction.
Record the metric even on the failure path. The most common instrumentation bug in LLM code is a record() call that only runs when nothing went wrong.
Streaming, where the interesting latency lives
For any user-facing generation, total duration is the wrong number. Users perceive time to first token; total duration only tells you how long the sentence was. The conventions define histograms for exactly this:
gen_ai.client.operation.time_to_first_chunk (seconds)gen_ai.client.operation.time_per_output_chunk (seconds)
ttfc = meter.create_histogram(
    "gen_ai.client.operation.time_to_first_chunk", unit="s",
    description="Time to first chunk of a streaming GenAI response.",
)
tpoc = meter.create_histogram(
    "gen_ai.client.operation.time_per_output_chunk", unit="s",
    description="Time between chunks of a streaming GenAI response.",
)


def chat_stream(client, model, messages, max_tokens=1024):
    base = {"gen_ai.operation.name": "chat",
            "gen_ai.provider.name": PROVIDER,
            "gen_ai.request.model": model}
    started = time.perf_counter()
    first_chunk_at = None
    chunks = 0

    with tracer.start_as_current_span(
        f"chat {model}", kind=trace.SpanKind.CLIENT,
        attributes={**base, "gen_ai.request.stream": True},
    ) as span:
        with client.messages.stream(model=model, max_tokens=max_tokens,
                                    messages=messages) as stream:
            for text in stream.text_stream:
                if first_chunk_at is None:
                    first_chunk_at = time.perf_counter()
                    ttfc.record(first_chunk_at - started, base)
                chunks += 1
                yield text

            final = stream.get_final_message()

        total = time.perf_counter() - started
        if chunks > 1 and first_chunk_at is not None:
            tpoc.record((total - (first_chunk_at - started)) / (chunks - 1), base)
        span.set_attributes({
            "gen_ai.usage.input_tokens": final.usage.input_tokens,
            "gen_ai.usage.output_tokens": final.usage.output_tokens,
        })
Note where the span ends: after the stream is fully consumed. The single most common streaming instrumentation bug is a context manager that closes when the generator is returned rather than when it's exhausted — which produces a beautiful dashboard showing 40 ms LLM calls. Also note that yield inside the span means the span stays open across the consumer's work; if your consumer is slow, that's now inside your latency. Sometimes that's what you want. Decide deliberately.
Agents: the spans that make a trace readable
An inference span alone tells you a model was called. It doesn't tell you why, or which of the six steps in your agent loop burned the time. That's what the agent spans are for:
| Span name | Kind | Operation |
|---|
create_agent {gen_ai.agent.name} | CLIENT | create_agent |
invoke_agent {gen_ai.agent.name} | CLIENT or INTERNAL | invoke_agent |
invoke_workflow {gen_ai.workflow.name} | INTERNAL | invoke_workflow |
plan {gen_ai.agent.name} | INTERNAL | plan |
execute_tool {gen_ai.tool.name} | INTERNAL | execute_tool |
Wrapping your agent loop is a dozen lines and changes what a trace is worth:
def run_agent(agent_name: str, conversation_id: str, task: str):
    with tracer.start_as_current_span(
        f"invoke_agent {agent_name}",
        kind=trace.SpanKind.INTERNAL,
        attributes={
            "gen_ai.operation.name": "invoke_agent",
            "gen_ai.provider.name": PROVIDER,
            "gen_ai.agent.name": agent_name,
            "gen_ai.conversation.id": conversation_id,
        },
    ):
        while not done:
            resp = chat(...)              # child inference span
            for call in tool_calls(resp):
                with tracer.start_as_current_span(
                    f"execute_tool {call.name}",
                    kind=trace.SpanKind.INTERNAL,
                    attributes={
                        "gen_ai.operation.name": "execute_tool",
                        "gen_ai.tool.name": call.name,
                        "gen_ai.tool.call.id": call.id,
                        "gen_ai.tool.type": "function",
                    },
                ):
                    run_tool(call)
There are matching metrics — gen_ai.invoke_agent.duration, gen_ai.invoke_agent.inference_calls, gen_ai.invoke_agent.tool_calls, gen_ai.execute_tool.duration, gen_ai.invoke_workflow.duration — and inference_calls per invocation is quietly the most useful number in the set. A histogram of "how many model calls did it take to finish one task" is your loop-efficiency metric; when its p95 doubles after a prompt change, you've found a regression that no eval and no latency panel would have surfaced. That interaction between telemetry and agent architecture is where most of the real tuning happens.
Prompts and completions: the part you should think about twice
The conventions capture content in a dedicated event, gen_ai.client.inference.operation.details, carrying:
gen_ai.input.messages — the chat history sent to the model, in ordergen_ai.output.messages — one entry per output choicegen_ai.system_instructions — system-level guidance, when the API separates itgen_ai.tool.definitions — the tools offeredgen_ai.prompt.variable — template variables resolved at runtime
Every one of these is marked Opt-In, and the spec attaches an explicit warning: "This attribute is likely to contain sensitive information including user/PII data."
Take it literally. Turning on content capture means your observability backend now stores user messages — which is a data-processing decision with GDPR consequences (retention, access control, subprocessor agreements, deletion requests), and, if what you're capturing includes AI-generated output about identifiable people, an EU AI Act conversation as well. "We turned on the debug flag" is not a lawful basis.
In Python, content capture is gated by an environment variable rather than code:
# Off by default. Enable deliberately, per environment.
export OTEL_INSTRUMENTATION_GENAI_CAPTURE_MESSAGE_CONTENT=true
(Traceloop's OpenLLMetry instrumentations use their own switch, TRACELOOP_TRACE_CONTENT=false, and default to capturing content on — worth checking before you deploy one.)
The pattern that works in practice: content capture on in dev and staging, off in production, with a sampled, redacted path for production debugging if you genuinely need one. You lose less than you'd think — traces without content still tell you the shape, the cost and the failure; and the qualitative "was the answer good" question belongs in an evaluation harness with a curated dataset, not in your trace store.
Auto-instrumentation, and the version problem
You don't have to write all of this. But you do have to know which generation of the conventions your library speaks, because the conventions moved and most libraries haven't caught up uniformly.
The two renames that will bite you:
- v1.27.0 —
prompt_tokens → input_tokens, completion_tokens → output_tokens
- v1.37.0 —
gen_ai.system → gen_ai.provider.name, and per-message events replaced by structured gen_ai.input.messages / gen_ai.output.messages / gen_ai.system_instructions
Instrumentations participating in the transition keep emitting the older shape by default so they don't break your dashboards. To get current behaviour you opt in:
export OTEL_SEMCONV_STABILITY_OPT_IN=gen_ai_latest_experimental
The library landscape as it stands: opentelemetry-instrumentation-openai-v2 in OpenTelemetry Python Contrib; Traceloop's OpenLLMetry packages, including opentelemetry-instrumentation-anthropic, for provider coverage; OpenInference for another take. Framework support is uneven — Pydantic AI emits the current structured format, Vercel's AI SDK ships a dedicated OTel package, some agent frameworks still default to the v1.36-era shape, and OpenAI's Agents SDK doesn't emit GenAI conventions natively at all.
And the honest caveat: the gen_ai.* surface is in Development status. It moved out of the main semantic-conventions repository (deprecated there in v1.42.0, June 2026) into a dedicated semantic-conventions-genai repository, which at the time of writing has no tagged release and no stable schema URL. Core attributes you rely on — error.type, server.address — are stable. The GenAI-specific ones can still be renamed between versions.
That's not a reason to wait. It's a reason to put your attribute names in one module instead of sprinkling string literals across forty call sites, so the next rename is one commit.
What to actually put on the dashboard
Instrumentation you don't query is a tax. Four panels earn their space:
- Cost per feature.
gen_ai.client.token.usage split by gen_ai.token.type and by your own feature dimension, multiplied by price per token. The conventions deliberately don't define a cost metric — prices change and live outside the app — so you derive it, and that derivation belongs in your dashboard, not in an attribute.
- p95 time-to-first-chunk, per model. The number your users feel. Alert on it; never alert on the mean.
- Tool error rate.
error.type on execute_tool spans, grouped by gen_ai.tool.name. In a healthy agent this is where problems show up first — the model is fine, the tool it's calling is returning garbage.
- Inference calls per agent invocation. The loop-efficiency signal described above. Prompt changes move it before they move anything else.
Two traps while you build those:
Cardinality. gen_ai.conversation.id and any user identifier belong on spans, never on metric attributes. One conversation id per metric series is how you turn a €200/month observability bill into a €9,000 one. Metrics get low-cardinality dimensions — provider, model, operation, feature, error type — and nothing else.
Sampling. If you head-sample traces at 10% and compute cost from spans, your cost is wrong by roughly 10×, and not consistently. Metrics are not sampled: cost and latency come from metrics, root-cause comes from the sampled traces. Keep those jobs separate. This is standard SRE discipline applied to a new dependency — the same discipline that makes AI infrastructure operable rather than merely deployed.
Conclusion
There is no special "LLM observability" discipline. There's tracing, there are metrics, and there's a schema — and the value of the GenAI conventions isn't that they're clever, it's that they're shared. Emit gen_ai.usage.output_tokens instead of tokens_out and every backend, every dashboard template and every teammate who joins next quarter already knows what it means. Emit execute_tool {name} as a child span and your agent stops being a black box in exactly one deploy.
Start with the inference span and the two metrics. Add agent and tool spans the first time a trace leaves you guessing. Leave content capture off in production until you've had the data-protection conversation. Put the attribute names in one module, because the spec is still moving.
Then go look at what your agent has actually been doing all this time. It is rarely what you assumed — and instrumenting it properly is the cheapest step between a demo that works and an LLM feature that runs in production.
Written by the team behind Cursuri-AI.ro, an AI education platform with hands-on English-language courses on production LLM integration, AI agents, evaluation, and shipping AI products.
Sources & further reading:
This article is educational content. The GenAI semantic conventions are pre-stable and attribute names change between versions — verify against the current specification before you standardise on them.
