How I combined Apache Flink, Redpanda, Airflow, dbt Cloud, and Grafana to track Bitcoin, Ethereum, Solana, BNB, and Cardano in real time — all running on Google Cloud for less than a cup of coffee per month.
If you've been learning data engineering, you've probably built pipelines that move CSV files from A to B. Nothing wrong with that — but real data engineering interviews are starting to ask a different question: Can you handle data that never stops arriving?
This article walks through CoinPulse, a project I built from scratch to answer that question. It's a hybrid streaming and batch crypto analytics pipeline that:
- Consumes live trade events from Binance's WebSocket feed at ~1 tick per second per coin
- Processes them with Apache Flink using 1-minute tumbling windows
- Enriches the streaming data daily with CoinGecko market metadata via Airflow
- Transforms everything with dbt Cloud
- Serves a live, auto-refreshing Grafana dashboard — publicly accessible
Total cloud cost: **~$0.01/month.**
Here's how I built it.
## The Problem I Was Solving
Crypto market data has two distinct tempos:
**Real-time (milliseconds to seconds):** Price ticks from exchanges. You need stream processing here — you can't batch-load ticks after the fact and call it "live." The data volume is too high to dump raw into a warehouse row by row.
**Daily (slow-moving context):** Market cap, trading volume, rankings, OHLC candlesticks. These change once a day. You don't need Flink for this — a simple scheduled API call works fine.
The interesting engineering challenge is: **how do you join these two tempos cheaply and reliably?**
The naive answer — stream everything into BigQuery using the Streaming Insert API — costs money at scale. The smarter answer is what I built: stream to GCS first, batch-load to BigQuery for free, and join the two lanes in dbt.
## Architecture Overview
Before diving in, here's the full picture:
```plaintext
STREAMING LANE
Binance WebSocket → Python Producer → Redpanda → PyFlink → GCS → BigQuery
(real-time ticks) (Kafka) (windows) (JSONL) (free load)
BATCH LANE
CoinGecko API → Airflow DAG (7 tasks) → GCS → BigQuery
(daily @ 06:00 UTC) (Parquet) (free load)
TRANSFORMATION LAYER
BigQuery → dbt Cloud → crypto_staging.* → crypto_mart.*
(daily @ 07:00 UTC)
VISUALIZATION
BigQuery → Grafana Cloud → 6 panels, auto-refresh 30s
(BigQuery plugin, free)
```
Everything runs locally in Docker except the data warehouse (BigQuery) and transformation/visualization layers (dbt Cloud + Grafana Cloud). This is the "local-to-cloud" pattern — keep compute on your machine, use GCP only for storage and analytics.
## The Streaming Lane: Binance → Redpanda → PyFlink → GCS
### Why Binance Instead of CoinCap?
I originally planned to use CoinCap's WebSocket feed. Halfway through the build, I discovered CoinCap now requires an API key even for the free tier. Binance's WebSocket, however, is completely open — no account, no key, no rate limits on the trade stream.
The URL pattern is:
```plaintext
wss://stream.binance.com:9443/stream?streams=btcusdt@trade/ethusdt@trade/solusdt@trade/bnbusdt@trade/adausdt@trade
```
Each message looks like:
```json
{
"stream": "btcusdt@trade",
"data": {
"s": "BTCUSDT",
"p": "76034.12",
"q": "0.00150000",
"T": 1776875894886
}
}
```
### The Python Producer
The producer is a Docker container running `websockets` + `confluent-kafka`. It connects to Binance, maps Binance pair names to readable coin names (`BTCUSDT → bitcoin`), and publishes JSON messages to a Redpanda topic:
```python
message = {
"symbol": "bitcoin",
"price_usd": 76034.12,
"event_timestamp": "2026-04-23T18:31:34+00:00"
}
producer.produce(topic="crypto-prices", key="bitcoin", value=json.dumps(message))
```
### Why Redpanda Instead of Kafka?
Kafka requires Zookeeper. In a local Docker setup, that's three containers just for the message broker (Zookeeper, Kafka broker, Schema Registry if you want it). Redpanda is Kafka-API compatible — meaning PyFlink's Kafka connector works with it unchanged — but runs as a **single binary, no Zookeeper**. It starts in under 3 seconds and uses ~512MB RAM instead of Kafka's 2-3GB.
### The PyFlink Job
The Flink job does the heavy lifting. It consumes from Redpanda, applies a **1-minute tumbling event-time window** per coin symbol, and computes:
- `avg_price` — average price within the window
- `min_price` / `max_price` — price range
- `price_stddev` — standard deviation (volatility proxy)
- `open_price` / `close_price` — first and last tick
- `record_count` — number of ticks received
Event-time windows (as opposed to processing-time) are important here. They use the timestamp embedded in the Binance message, so late-arriving messages (within a 10-second watermark) land in the correct window rather than the current one.
The output of each completed window is a JSONL file written to GCS:
```plaintext
gs://coinpulse-data-lake/streaming/2026/04/23/18/stream_bitcoin_20260423_183134.jsonl
```
A scheduled BigQuery Load Job (free) then loads these files into `crypto_raw.stream_prices`, partitioned by HOUR on `event_timestamp` and clustered by `symbol`.
**The key insight here:** I never use BigQuery's Streaming Insert API, which charges ~$0.01 per 200MB. Load Jobs are completely free. The data is 1 minute old in the warehouse instead of 0 seconds old — but for a dashboard refreshing every 30 seconds, nobody notices.
The Batch Lane: CoinGecko → Airflow → GCS → BigQuery
The Airflow DAG
The batch pipeline runs as a 7-task Airflow DAG at 06:00 UTC daily with two parallel branches:
fetch_coingecko → transform_to_parquet → upload_to_gcs → load_to_bigquery
fetch_ohlc      → upload_ohlc_to_gcs   → load_ohlc_to_bigquery
Markets branch hits CoinGecko's /coins/markets endpoint for all 5 coins in a single call, getting current price, market cap, 24h volume, price change percentage, rank, and fully diluted valuation.
OHLC branch hits /coins/{id}/ohlc?days=1 for each coin, getting candlestick arrays [timestamp, open, high, low, close].
Both branches serialize data to typed Parquet (using explicit schema definitions, not autodetect — more on why this matters below) and upload to GCS before loading to BigQuery.
The Schema War (And How I Won It)
This took me longer than I'd like to admit. The root cause: PyArrow (used by Pandas .to_parquet()) infers Python datetime objects as TIMESTAMP in Parquet metadata. But when BigQuery's autodetect reads a datetime.isoformat() string, it creates the column as STRING. When the same column arrives as a proper datetime object in the next run, BigQuery rejects the load because TIMESTAMP ≠ STRING.
The permanent fix: define explicit schemas in the BigQuery Load Job config and force all string columns to str dtype in Pandas before writing Parquet:
df["snapshot_date"] = df["snapshot_date"].astype(str)
df["ingested_at"]   = df["ingested_at"].astype(str)

job_config = bigquery.LoadJobConfig(
    source_format=bigquery.SourceFormat.PARQUET,
    schema=MARKETS_SCHEMA,  # explicit, no autodetect
    write_disposition=bigquery.WriteDisposition.WRITE_APPEND,
)
Once I stopped fighting autodetect and defined schemas explicitly, the pipeline ran clean for weeks.
Why dbt Cloud Over dbt Core
I already had Redpanda, Flink, Airflow, and PostgreSQL running locally — approximately 13GB RAM. Adding a dbt Core Docker container would push that higher for no functional gain. dbt Cloud's free developer plan gives a managed scheduler, visual lineage graph, and test runner at zero cost and zero local RAM.
The Model Structure
Staging layer (views, zero storage cost):
stg_stream_prices — cleans and type-casts streaming data, filters nulls and zero pricesstg_coingecko_markets — adds market_cap_category (large/mid/small/micro cap) derived columnstg_ohlc_candles — computes candle_range, candle_change_pct, and candle_direction (bullish/bearish)
Mart layer (incremental tables, insert_overwrite):
mart_crypto_prices — joins streaming aggregations with latest daily market metadatamart_volatility — computes hourly composite_volatility_score combining streaming stddev with OHLC candle metrics
The mart models use insert_overwrite with hour-level partitioning and an incremental filter that scans only the last 2 hours of streaming data per run. This means dbt never full-scans the streaming table — it touches only the partitions it needs to update.
The dbt Deploy Job
A scheduled dbt Cloud production environment job runs daily at 07:00 UTC — one hour after Airflow — ensuring mart tables always have fresh data before the dashboard refreshes.
After some initial failures (a common dbt Fusion syntax issue with accepted_values requiring arguments: nesting), the deploy job has run cleanly every day since April 19, 2026. Each run completes in under 45 seconds.
The Dashboard: Grafana Cloud
Why Grafana Over Looker Studio
Looker Studio is the natural choice for BigQuery — it has a native connector and no setup friction. But it has one fatal flaw for streaming analytics: it doesn't auto-refresh.
Grafana Cloud's free tier includes the BigQuery plugin (one-click install, no credit card), supports 30-second auto-refresh, has proper time series panels with logarithmic Y-axis (essential when plotting BTC at $76K alongside ADA at $0.25 on the same chart), and produces significantly more polished visualizations.
My prior projects (Sovereign Debt Observatory, Tech Ecosystem Observatory) both used Looker Studio, so using Grafana here also demonstrates range across tooling.
The 6 Dashboard Panels
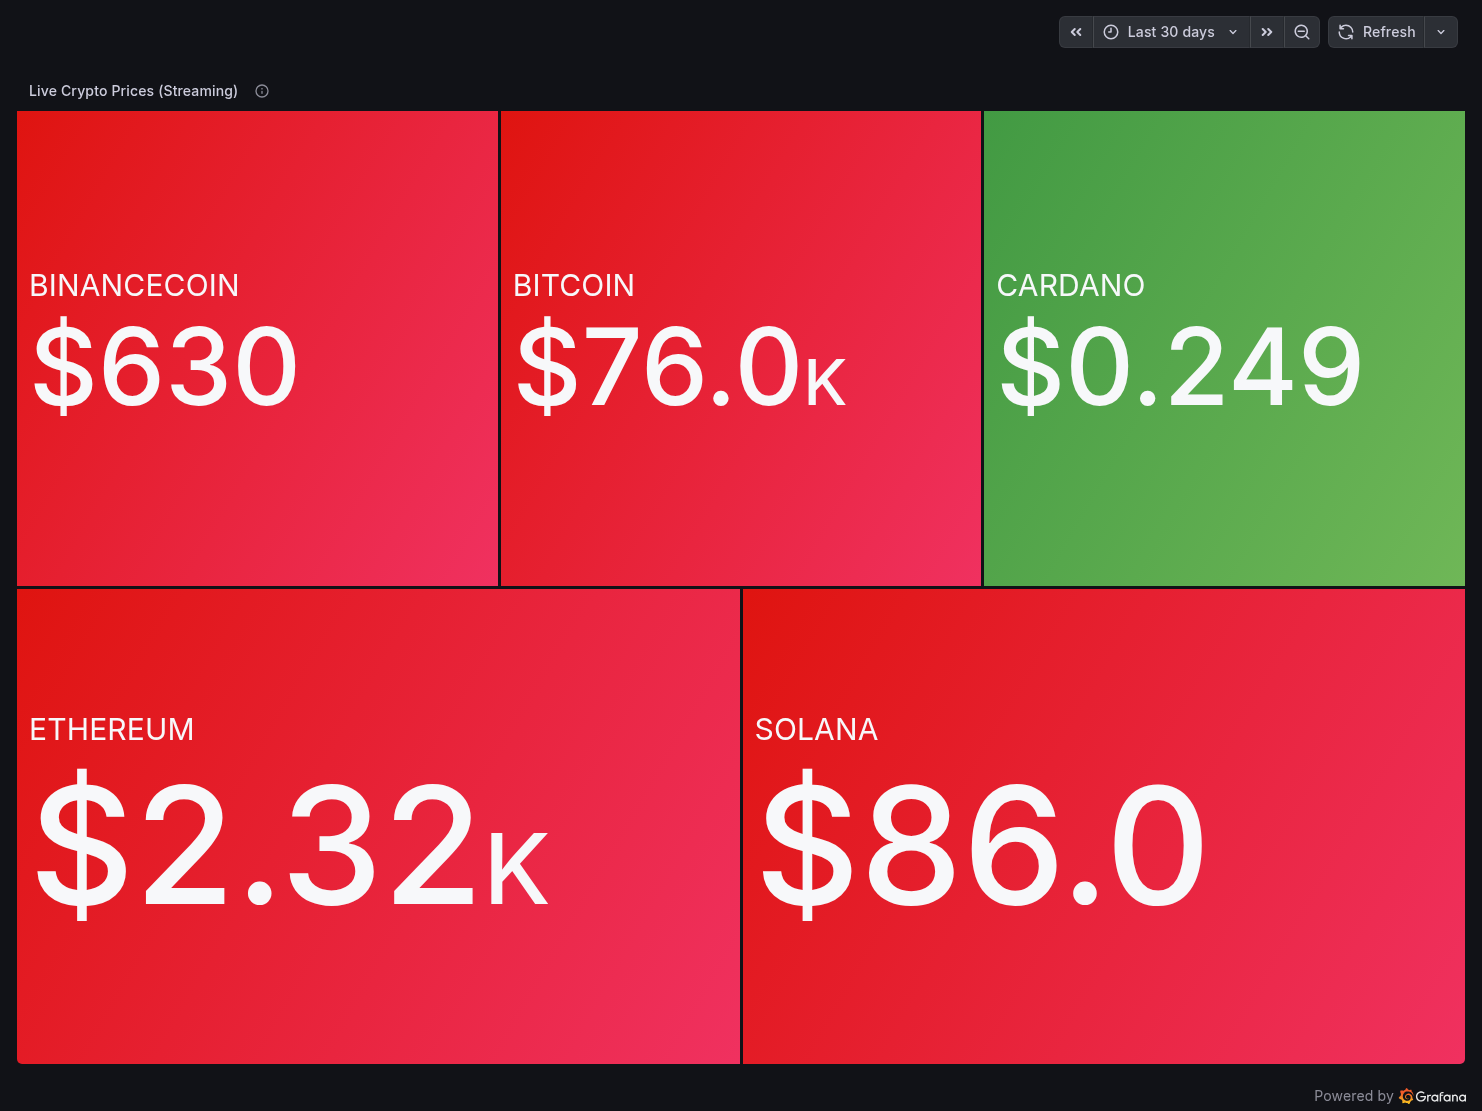
Panel 1 — Live Crypto Prices (Streaming)
A treemap showing the latest price for each coin from crypto_raw.stream_prices, colour-coded green/red by price direction. BTC at $76K, ETH at $2.3K, SOL at $86, BNB at $630, ADA at $0.249.
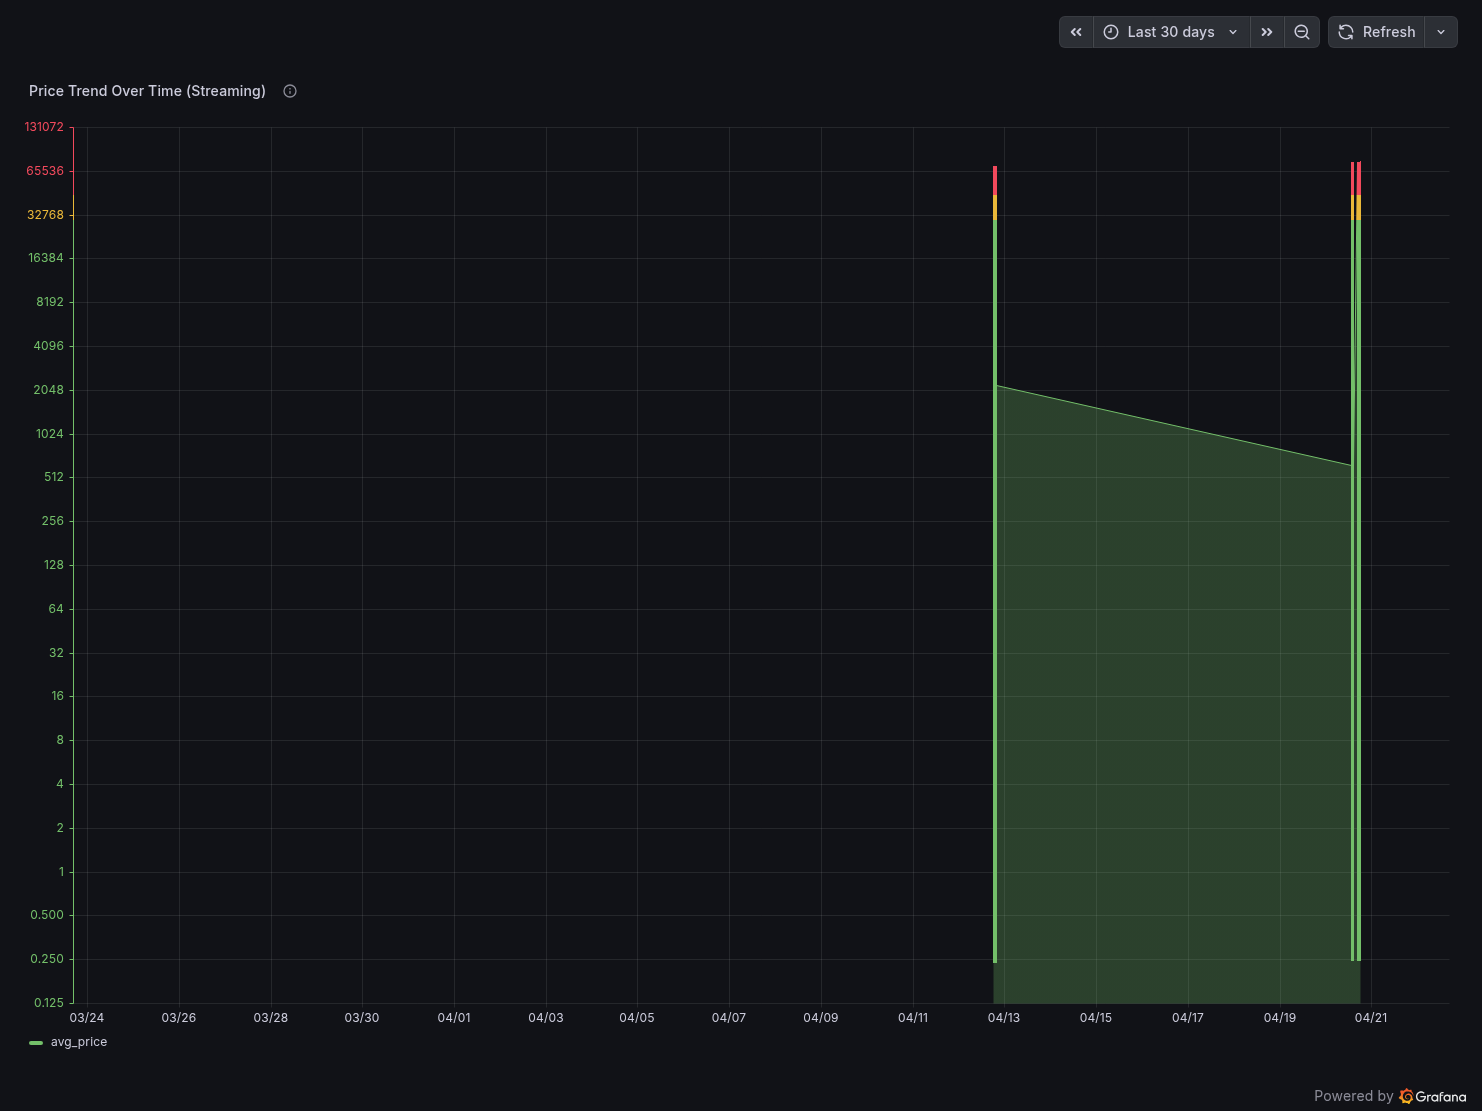
Panel 2 — Price Trend Over Time (Streaming)
A time series chart with logarithmic Y-axis showing avg_price per 1-minute window for all coins. The log scale handles the 300,000x price spread between BTC and ADA.
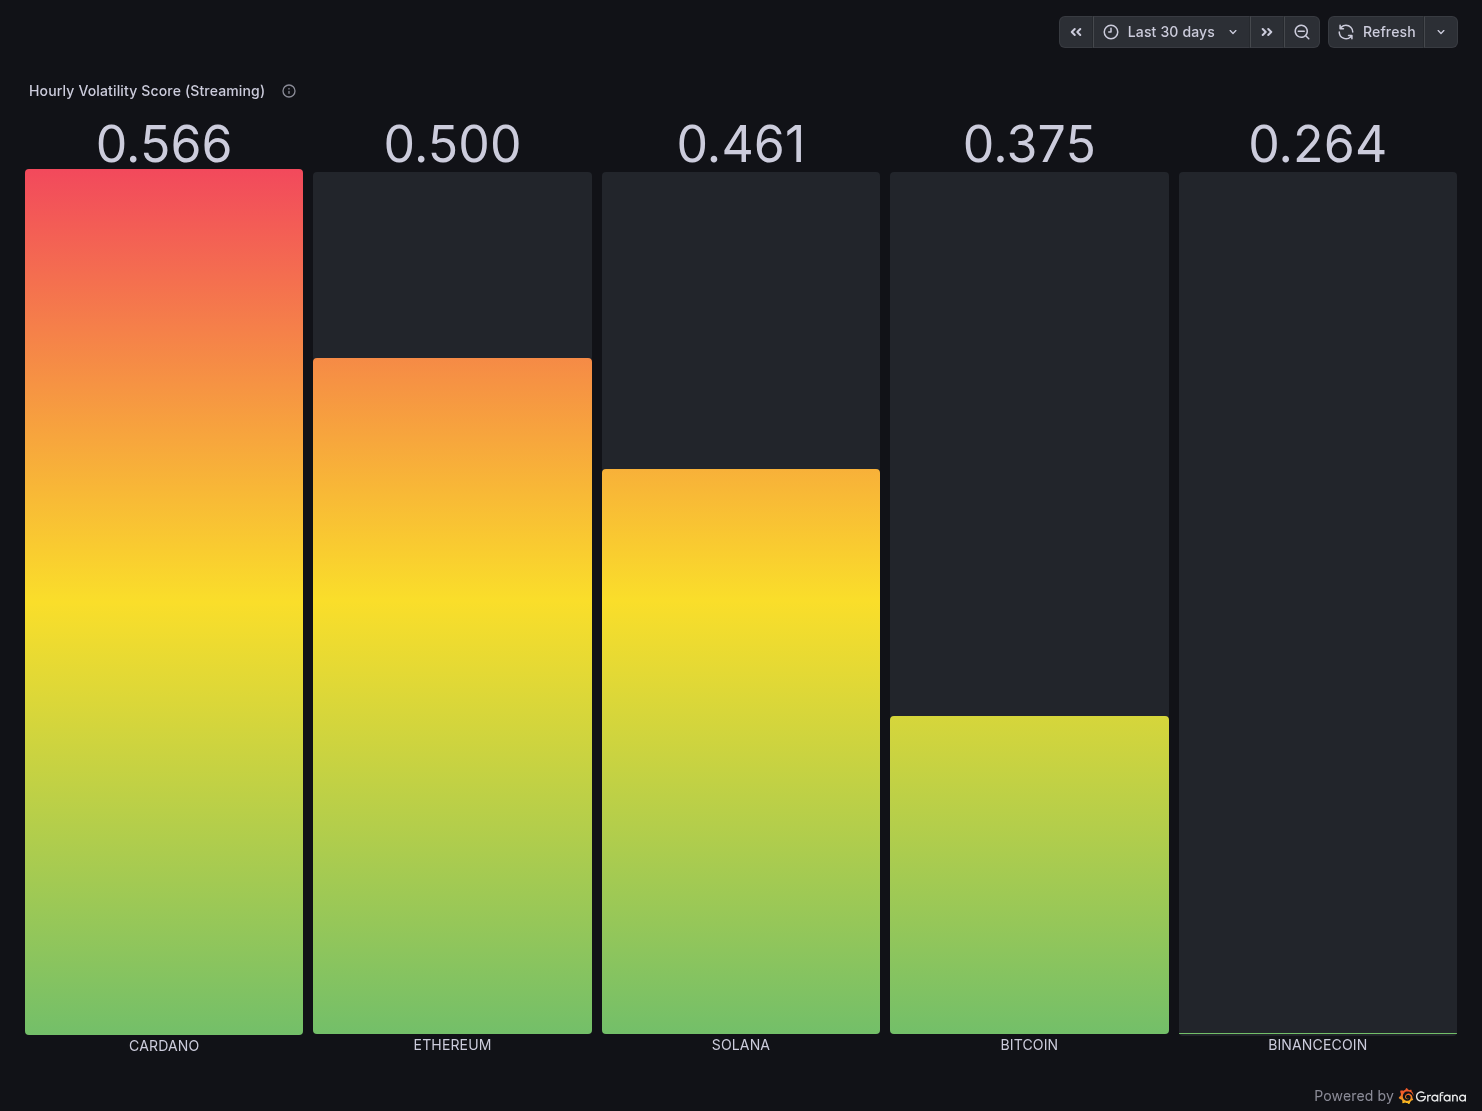
Panel 3 — Hourly Volatility Score (Streaming)
A gradient bar chart (green → red) showing the composite_volatility_score per coin from mart_volatility. Cardano leads at 0.566 (most volatile relative to its price), Binance Coin lowest at 0.264.
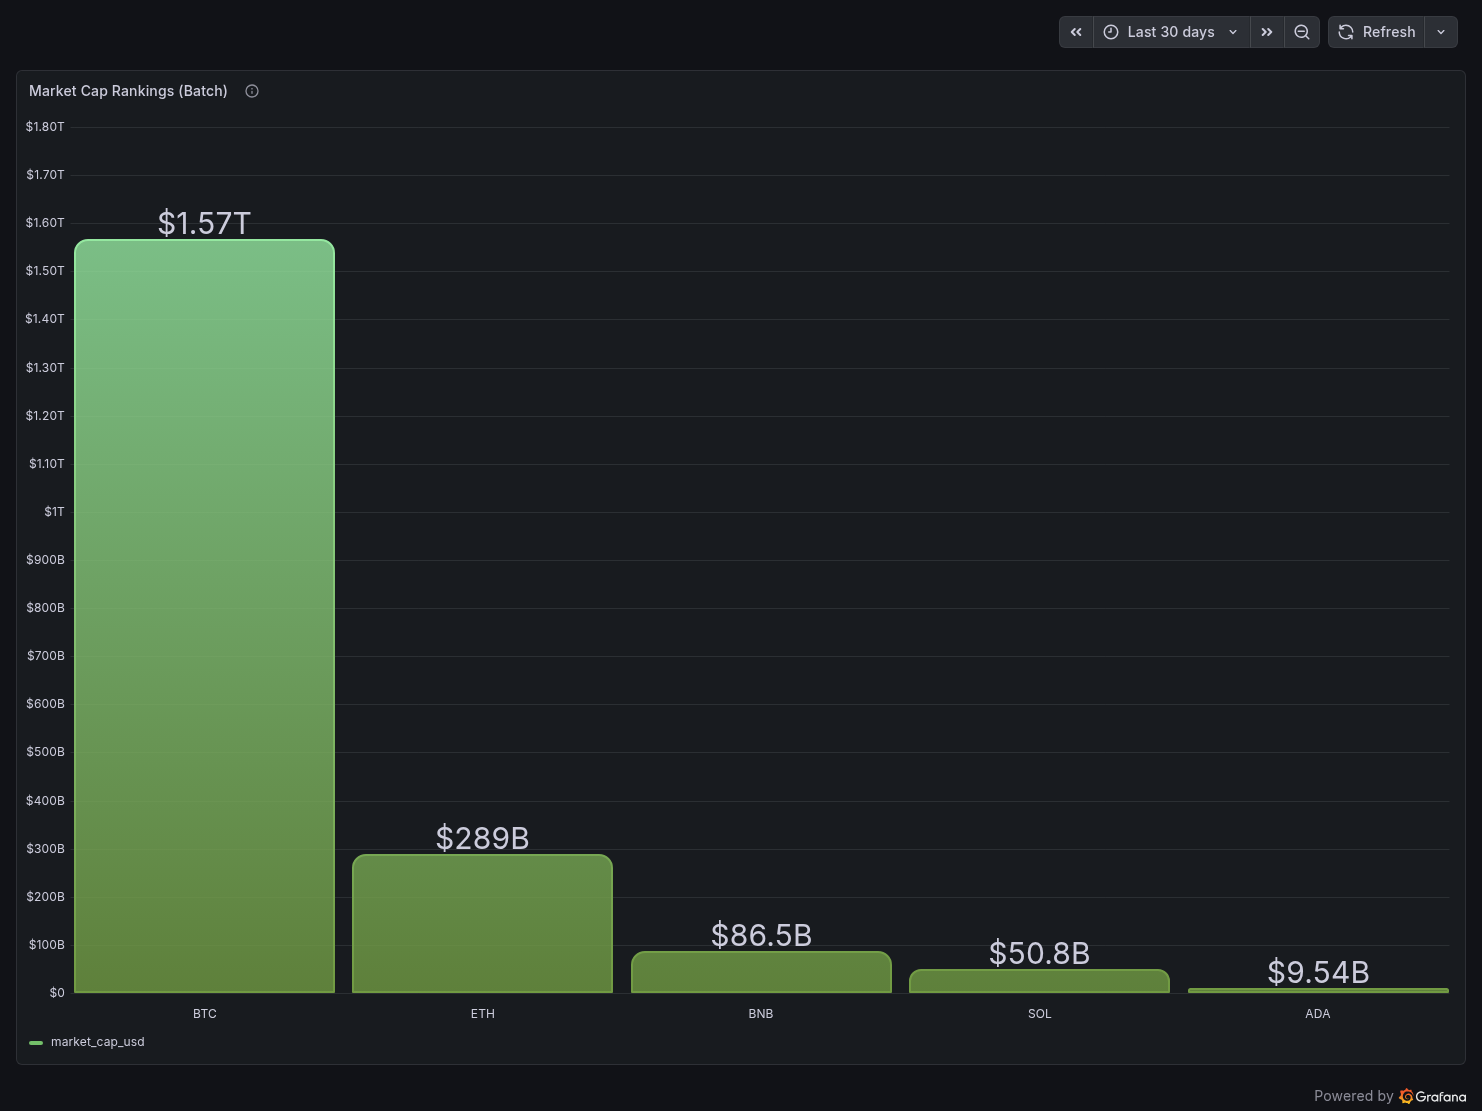
Panel 4 — Market Cap Rankings (Batch)
BTC dominates at $1.57T, ETH at $289B. The scale difference is immediately visible and gives context to the streaming data.
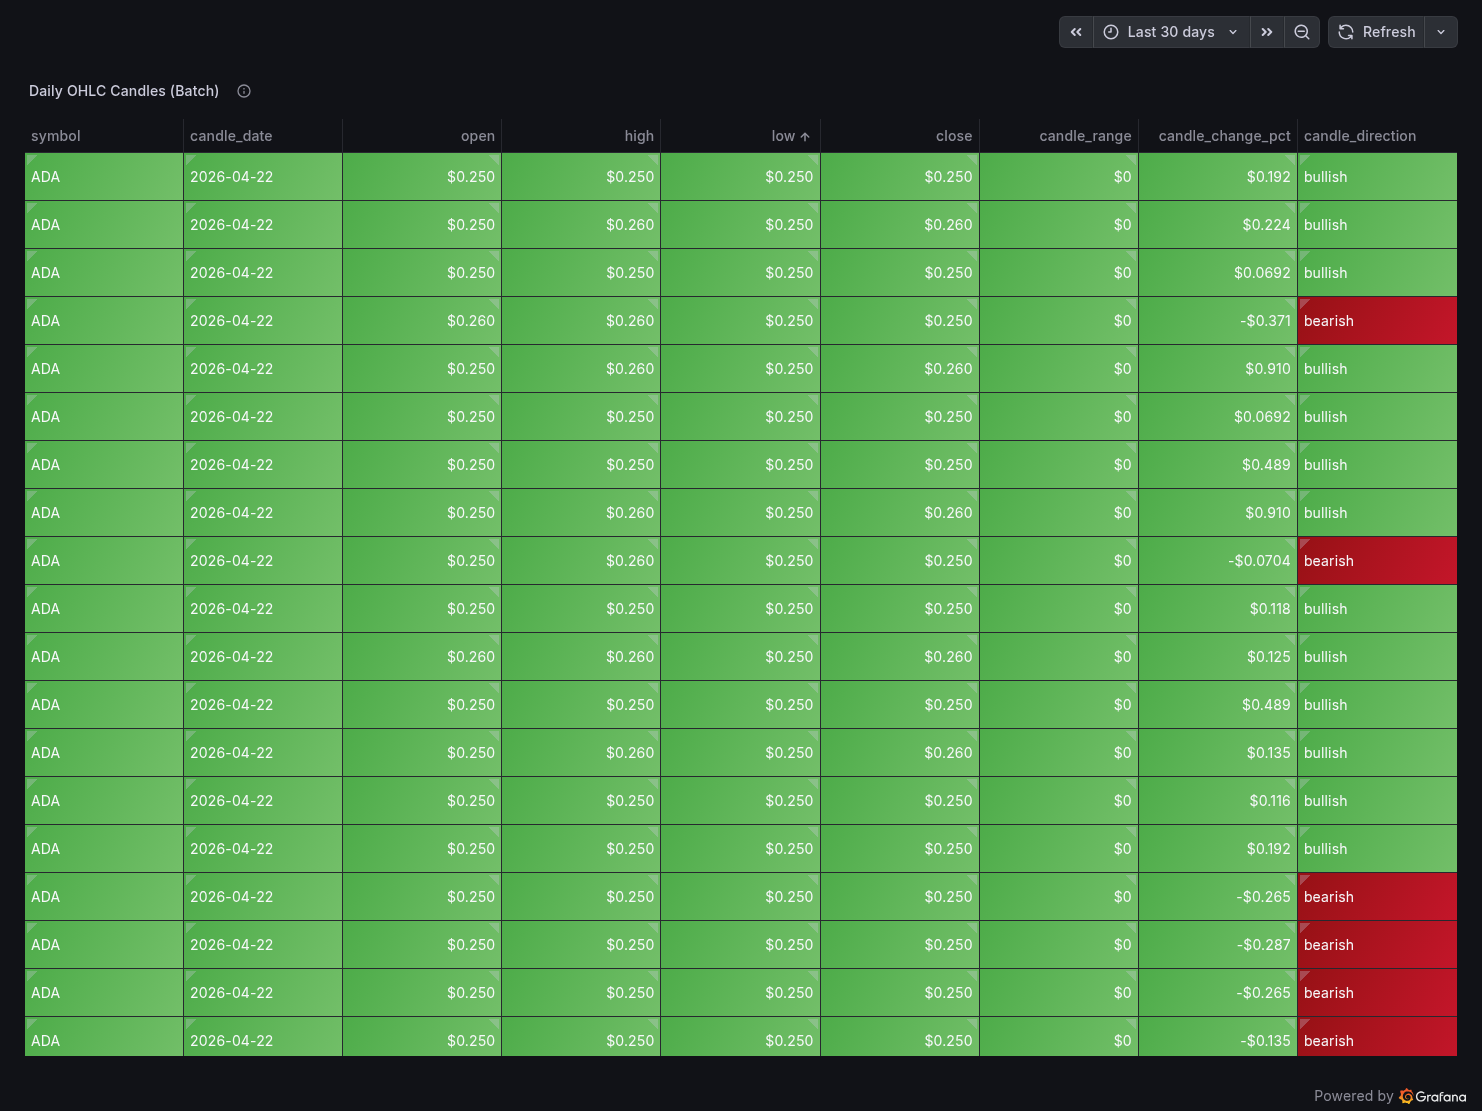
Panel 5 — Daily OHLC Candles (Batch)
A table panel showing raw candle data from coingecko_ohlc_candles with candle_direction colour-coded — bearish rows highlighted in red.
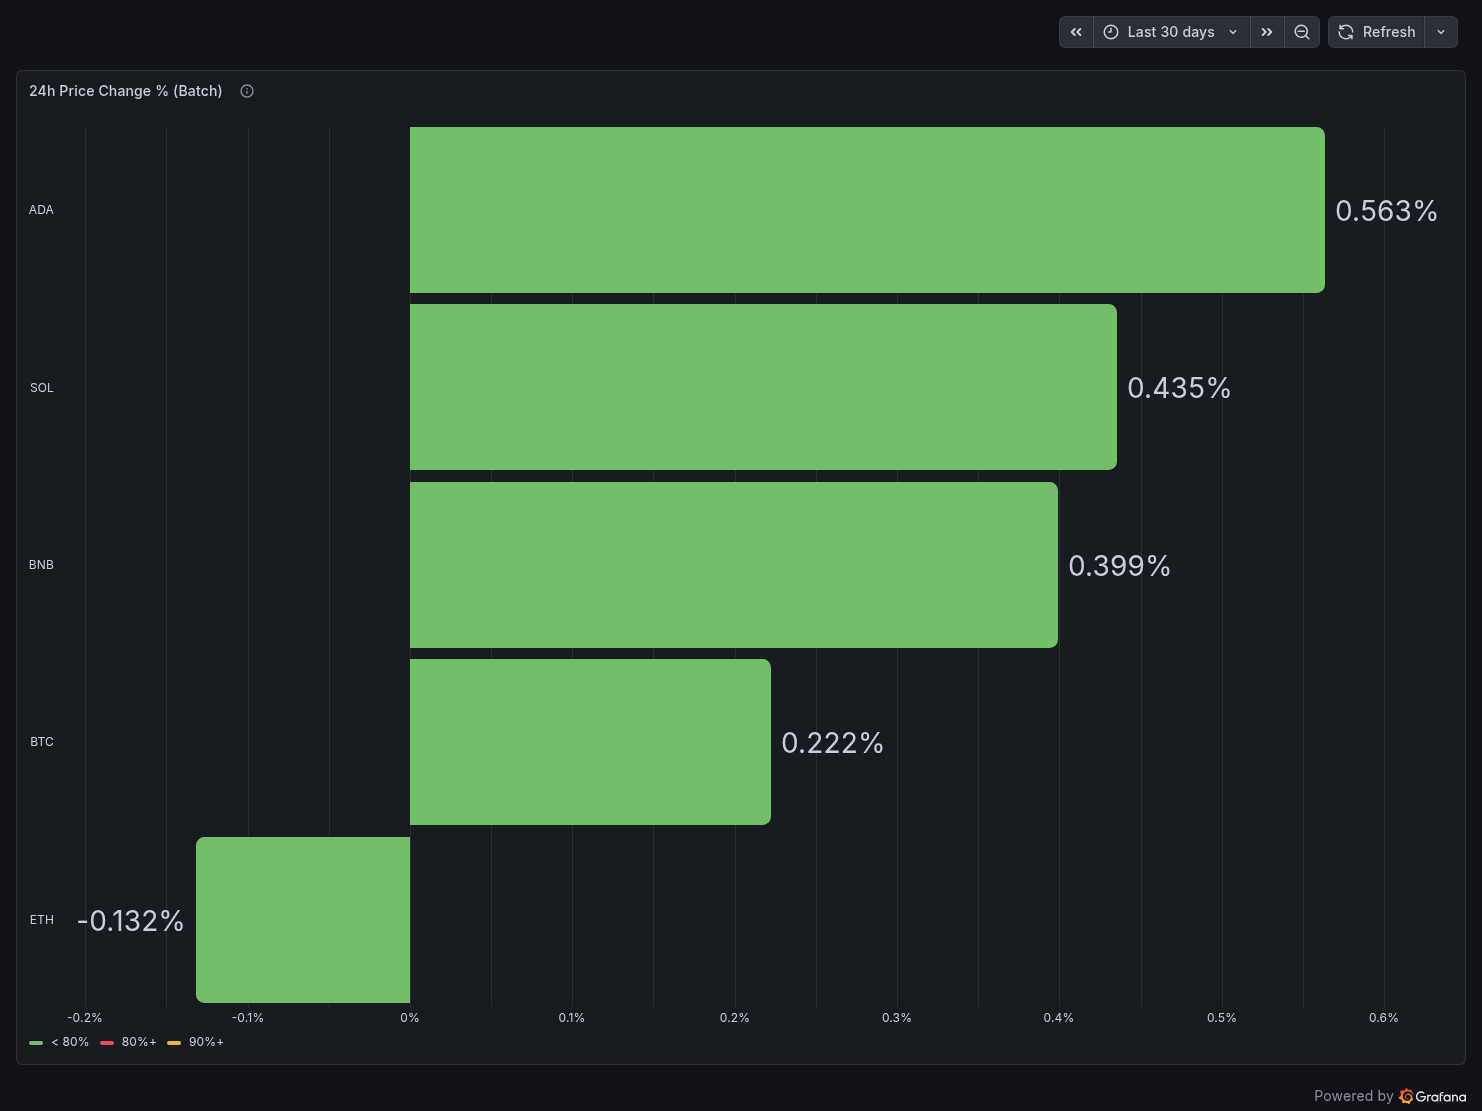
Panel 6 — 24h Price Change % (Batch)
ADA leads at +0.563%, ETH is the only negative at -0.132%.
Public URL: https://derrickryangiggs.grafana.net/public-dashboards/81560968e15140f08f65b52d78a4b252
All GCP resources are defined in Terraform — nothing clicked in the console. Running terraform apply provisions:
- GCP project with billing account linked
- Required APIs (BigQuery, BigQuery Storage, Cloud Storage, Resource Manager)
- Service account with least-privilege IAM roles (BQ Data Editor, BQ Job User, GCS Object Admin)
- GCS bucket with 90-day lifecycle rule
- BigQuery datasets and tables with explicit schemas, partitioning, and clustering
Nothing is hardcoded. All values flow from .env via TF_VAR_ prefixed variables. This is non-negotiable — hardcoded project IDs in .tf files are a code review failure waiting to happen.
The Cost Breakdown (For Real)
| Service | Details | Monthly Cost |
|---|
| Redpanda | Local Docker | $0.00 |
| PyFlink | Local Docker | $0.00 |
| Apache Airflow | Local Docker | $0.00 |
| Google Cloud Storage | ~200MB of Parquet + JSONL | ~$0.01 |
| BigQuery | <1GB data, Load Jobs only | ~$0.00 |
| dbt Cloud | Developer plan | $0.00 |
| Grafana Cloud | Free tier | $0.00 |
| **Total** | | **~$0.01/month** |
The $0.01 is literally the GCS storage bill. Everything else is free.
The three decisions that make this possible:
Use GCS + Load Jobs instead of BigQuery Streaming Inserts. Streaming Inserts charge per row. Load Jobs are free. The trade-off is 1-minute data freshness instead of real-time — acceptable for a dashboard refreshing every 30 seconds.
Run compute locally. Cloud Composer (managed Airflow) starts at $300/month. Dataproc (managed Flink) is similarly expensive. Running on your own machine costs nothing except electricity.
Use free tiers everywhere else. dbt Cloud developer plan, Grafana Cloud free tier, CoinGecko Demo API free tier, Binance WebSocket (no auth required). Every external service in this pipeline has a genuinely free tier sufficient for this workload.
Hard-Won Lessons
1. Flink's WindowFunction.apply() signature changed in 2.2.0
In PyFlink 1.18, apply(self, key, window, inputs, collector) uses a collector argument. In 2.2.0, the signature is apply(self, key, window, inputs) and you use yield instead. This isn't documented prominently. I lost an afternoon to this.
2. Read env vars inside functions, not at module import time
My Airflow DAG originally read GCS_BUCKET_NAME = os.environ["GCS_BUCKET_NAME"] at the module level. When Airflow's scheduler reloads the module after a container restart, GCS_BUCKET_NAME is empty — the env var isn't available at import time in the scheduler process. Moving all os.environ reads inside the task functions fixed this permanently.
3. Never use autodetect for BigQuery Load Jobs if you care about schema stability
autodetect=True infers schema from the first file it sees. If that file has a datetime object, BQ creates a TIMESTAMP column. If the next file has an .isoformat() string, BQ rejects it as a STRING / TIMESTAMP mismatch. Define explicit schemas in the LoadJobConfig and cast DataFrame columns explicitly before writing Parquet.
4. The Flink TaskManager won't connect if jobmanager.rpc.address in config.yaml doesn't match your Docker container name
The baked-in config.yaml in the PyFlink image has jobmanager.rpc.address: jobmanager. My container is named coinpulse-flink-jobmanager. The FLINK_PROPERTIES env var doesn't always override config.yaml. The fix: add a sed command in the Dockerfile to rewrite the address in config.yaml directly.
5. Redpanda's rpk topic create command arguments must be on one line
Multi-line bash in Docker Compose entrypoint with > YAML block scalar doesn't handle line continuations the way you'd expect. The --brokers, --partitions, and --replicas flags ended up being interpreted as separate commands. Fix: use ["bash", "-c", "single long command string"] format instead.
What I'd Add Next (The "Circuit Breaker" Enhancements)
After sharing the project, I got feedback suggesting three production-grade improvements. Here's my assessment:
1. dbt-expectations data contracts
Add guardrails so the pipeline fails loudly if bad data arrives — negative prices, null coin symbols, impossible price spikes. In dbt, this is two lines per test in your schema YAML. The dbt-expectations package brings expect_column_values_to_be_between and similar assertions. Highly recommended, zero cost.
2. BigQuery ML ARIMA_PLUS price forecasting
Train a time series model directly in BigQuery SQL to forecast the next 7 days of prices per coin. The first 10GB of CREATE MODEL data processed monthly is free — both projects' datasets are well under that threshold, making this effectively free. It turns the dashboard from "here's what happened" into "here's what might happen."
3. GitHub Actions CI/CD for Terraform
A terraform plan on every PR to the repo, ensuring infrastructure changes are reviewed before applying. Standard practice in production environments, takes about 20 lines of GitHub Actions YAML to implement.
The Full Stack, Summarised
| Layer | Tool | Why |
|---|
| IaC | Terraform | Reproducible, version-controlled infrastructure |
| Message Broker | Redpanda | Kafka-compatible, no Zookeeper, runs in one container |
| Stream Processing | PyFlink 2.2.0 | Stateful windowed aggregations, event-time semantics |
| Orchestration | Apache Airflow | Full end-to-end DAG, retry logic, monitoring |
| Object Storage | GCS | Staging layer between compute and warehouse |
| Data Warehouse | BigQuery | Serverless, free Load Jobs, columnar, partitioned |
| Transformations | dbt Cloud | Incremental models, lineage graph, scheduled runs |
| Visualization | Grafana Cloud | Auto-refresh, BigQuery plugin free on all tiers |
Try It Yourself
The full project is open source:
GitHub: https://github.com/Derrick-Ryan-Giggs/coinpulse
Live Dashboard: https://derrickryangiggs.grafana.net/public-dashboards/81560968e15140f08f65b52d78a4b252
The README has step-by-step reproduction instructions — clone, fill in .env, run terraform apply, start the Docker stacks, and you have a running pipeline within about 20 minutes. All you need is a GCP account (free tier works), a CoinGecko Demo API key (free, no card), dbt Cloud account (free developer plan), and Grafana Cloud account (free forever).
What This Project Taught Me
Building this reinforced something I suspected but didn't fully appreciate: the hardest problems in data engineering aren't the algorithms — they're the plumbing.
Getting PyFlink to connect to a Redpanda broker with the right container hostname was a day of debugging. Getting the Airflow DAG to read env vars correctly on scheduled runs (not just manual triggers) was another. Getting BigQuery to accept the same schema consistently across runs required understanding how PyArrow serialises Python types to Parquet column metadata.
None of these problems are glamorous. But solving them is what separates a "pipeline that worked once on my laptop" from a "pipeline that runs reliably every day."
That's what CoinPulse is — a pipeline that runs reliably every day, for $0.01/month.
If you found this useful or have questions about any part of the implementation, feel free to reach out. I write regularly about data engineering, cloud infrastructure, and GCP on Medium, Dev.to, and Hashnode.