As developers, we all have a favorite debugging tool: console.log. It is simple, it is fast, and it gets the job done when we are trying to figure out why a variable is undefined on our local machine. But the habits we build in development can become liabilities in production. Relying on console.log for a live application is like trying to find a specific grain of sand on a beach. It is inefficient, unstructured, and makes debugging real-world issues a nightmare.
I have seen teams spend hours, sometimes days, sifting through messy, unsearchable log files, all because their logging strategy never matured beyond what they used for local development. Effective logging is not a feature you add at the end. It is a core part of a robust, maintainable, and observable system. Let’s explore how to level up from basic console statements to a professional logging setup that will save you time and headaches.
Why console.log Is Not Enough for Production
When your application is running on a server, handling requests from thousands of users, console.log('User created') just does not cut it. Here is why it falls short:
1. No Structure
A console.log statement outputs a simple string. While easy for a human to read one line at a time, it is very difficult for a machine to parse. Imagine you want to find all log entries for a specific user, or only show errors that happened after a certain time. With plain text logs, you are stuck using complex regular expressions. This is slow and error-prone.
Production logs should be structured, typically as JSON. This allows you to easily filter, search, and aggregate logs in a dedicated logging tool.
- Before (console.log):
User 123 failed to update profile.
- After (Structured Log):
{"level":"error","time":1678886400000,"pid":456,"hostname":"server-1","userId":123,"msg":"Failed to update profile"}
2. No Log Levels
Not all log messages are equal. A message indicating the server has started is informational. A failed database connection is a critical error. console.log has no concept of severity. While console.warn and console.error exist, they do not offer the granularity needed for a production system.
Standard log levels include:
fatal: The application is about to crash. A critical, service-ending event.error: A serious error occurred, but the application can continue running (e.g., a failed API call to a third party).warn: Something unexpected happened that is not an error but should be monitored (e.g., deprecated API usage).info: Routine information about the application's operation (e.g., server started, user signed in).debug: Detailed information useful only for debugging, typically turned off in production.trace: Even more granular information, like detailed function call traces.
Using levels allows you to configure your logger to only output messages of a certain severity. In production, you might set the level to info, while in development, you might set it to debug.
3. Inflexible Output
console.log always writes to the standard output (stdout). In a production environment, you need more control. You might want to write logs to a file, send them to a third-party logging service like Datadog or Logstash, or even suppress them entirely during tests.
A proper logging library allows you to configure different destinations, called "transports" or "streams".
The Pillars of Good Logging
To build a production-ready logging system, we need to focus on a few key principles.
- Structured Data: Always log in a machine-readable format like JSON.
- Log Levels: Use severity levels to categorize your logs.
- Context is King: Every log entry should contain context to help you trace its origin. The most important piece of context is a unique request identifier.
- Configurable Destinations: Your application should not care where the logs go. The logging setup should handle routing them to the correct place based on the environment.
While there are several great logging libraries for Node.js, such as Winston and Bunyan, my go-to choice for new projects is Pino. It is incredibly fast and has very low overhead, which is important in a high-throughput Node.js application. It focuses on doing one thing well: emitting structured JSON logs.
Let’s get started with a basic Pino setup.
First, install it:
npm install pino
Now, let's create a simple logger instance:
// logger.js
const pino = require('pino');

const logger = pino({
  level: process.env.LOG_LEVEL || 'info', // Default to 'info'
  formatters: {
    level: (label) => {
      return { level: label.toUpperCase() };
    },
  },
  timestamp: pino.stdTimeFunctions.isoTime,
});

module.exports = logger;
In this setup, we configure a few things:
- The log
level is set from an environment variable, falling back to info. This is crucial for controlling log verbosity across different environments.
- We use a
formatter to make the level label uppercase for consistency.
- We set a standard ISO timestamp.
Now you can use this logger anywhere in your app:
const logger = require('./logger');

logger.info('Server is starting...');
logger.warn({ component: 'database' }, 'Connection is a bit slow.');
logger.error(new Error('Failed to connect to Redis'), 'Redis connection error.');
Notice how we can pass an object as the first argument. Pino merges this object into the final JSON log line, which is the perfect way to add context.
A Practical Example: Logging in an Express.js App
Let's integrate our logger into a simple Express server. The goal is to automatically log every incoming request and ensure all logs generated while handling that request are tied together with a unique ID.
We will use pino-http, a companion library for Pino.
npm install express pino-http uuid
Now, let's set up our server:
// server.js
const express = require('express');
const pinoHttp = require('pino-http');
const { v4: uuidv4 } = require('uuid');
const logger = require('./logger');

const app = express();

// Add the pino-http middleware
app.use(pinoHttp({
  logger,
  // Define a custom request ID generator
  genReqId: function (req, res) {
    const existingId = req.id ?? req.headers['x-request-id'];
    if (existingId) return existingId;
    const id = uuidv4();
    res.setHeader('X-Request-Id', id); // Set it on the response header
    return id;
  },
}));

app.get('/', (req, res) => {
  // pino-http adds the logger to the request object
  req.log.info({ user: 'guest' }, 'User accessed the home page');
  res.status(200).send('Hello, world!');
});

app.get('/error', (req, res) => {
  const err = new Error('This is a simulated error!');
  req.log.error({ err }, 'An error occurred on the /error route');
  res.status(500).send('Something went wrong.');
});

app.listen(3000, () => {
  logger.info('Server running on http://localhost:3000');
});
When you run this server and hit the / endpoint, you will see two log lines:
- An
info log from our route handler.
- Another
info log that pino-http automatically generates when the response is sent, including the status code and response time.
Both log lines will share the same req.id, which is our unique request identifier. This is incredibly powerful. If a user reports an error, you can ask them for the X-Request-Id from the response header and instantly find every single log associated with their request, even across multiple microservices if you pass the ID along.
Managing Logs in a Production Environment
Generating logs is only half the battle. You also need a strategy for collecting, storing, and analyzing them.
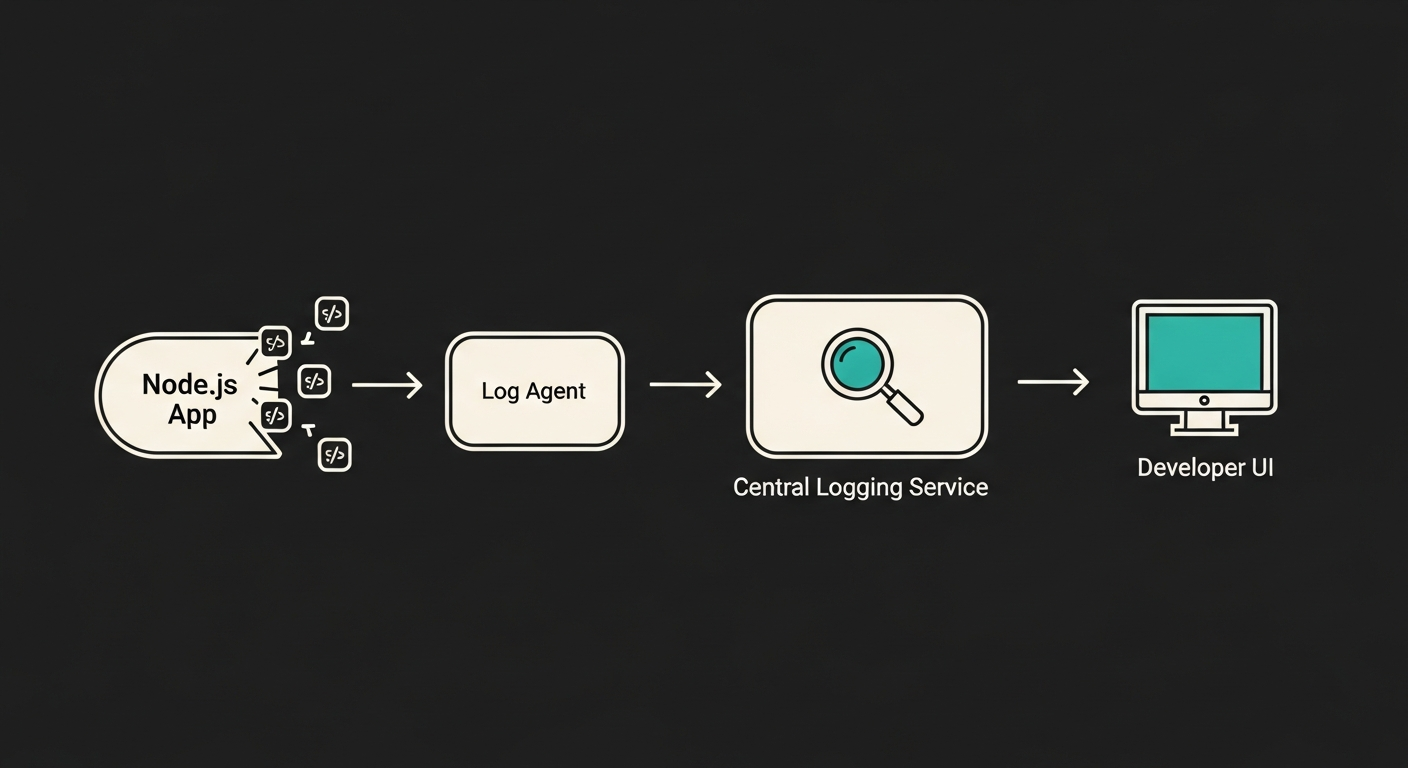
This diagram shows a typical production logging pipeline:
- Application (
Node.js App): Your application writes JSON logs to stdout.
- Log Agent (
Log Agent on Server): A lightweight agent (like Fluentd or Vector) running on the same server collects these logs from stdout.
- Central Logging Service: The agent forwards the logs to a centralized system like Elasticsearch, Datadog, or Logz.io.
- Storage and Analysis: The service stores, indexes, and provides a user interface (like Kibana) for searching, visualizing, and creating alerts from the log data.
This approach decouples your application from the logging backend. Your Node.js app's only job is to write structured logs to standard output. The rest is handled by the infrastructure, which is a key principle of the Twelve-Factor App methodology.
graph TD
    A[Node.js App] -- JSON logs to stdout --> B(Log Agent on Server);
    B -- Ships logs --> C{Central Logging Service};
    C -- Stores & Indexes --> D[(Log Database)];
    E[Developer] -- Queries & Visualizes --> C;
    D -- Provides data --> C;
Best Practices and Common Pitfalls
Finally, here are some hard-won lessons from years of managing production systems.
- DO log in JSON. I cannot stress this enough. It is the foundation of modern observability.
- DO include a request ID in every log entry related to a request.
- DON'T log sensitive information. Never log passwords, API keys, or personally identifiable information (PII). Use Pino's redaction features to automatically strip sensitive fields from your log objects.
const logger = pino({
  redact: ['password', 'user.email']
});
logger.info({ user: { name: 'Qudrat', email: '*Emails are not allowed*' }, password: '123' });
// The email and password will be replaced with '[REDACTED]'
- DO log errors with their stack traces. The error message alone is often not enough.
logger.error({ err: myError }, 'A message') will automatically include the stack trace when you pass the error object.
- DON'T be too noisy. Logging has a cost, both in performance and in storage. Use the
info level for significant events, not for every single function call. Save verbose logging for the debug level, which you can enable on demand.
Moving beyond console.log is a sign of a maturing developer. It shows you are thinking not just about making the code work, but about how it will be operated, monitored, and debugged in the real world. By embracing structured logging, you are building more resilient and maintainable applications, and your future self (and your team) will thank you for it.