title: "From Ansible to AI: Automating Network Diagnostics with sping"
published: true
description: "Turn server inventories into network health reports using Rust, JSON, jq, and AI. Five practical automation examples with sping 1.7.1."
Imagine this: a deployment just finished, something is slow, and you have 60 machines in an Ansible inventory.
You could SSH into each one. You could run ping 60 times. You could copy terminal output into a spreadsheet and spend the next half hour figuring out which hosts actually have a problem.
Or you could turn that inventory into a machine-readable network report, filter it in a few seconds, and hand the evidence to a script—or even an AI assistant.
That's one of the reasons I built sping, a small, open-source network diagnostics CLI written in Rust.
The live terminal view is nice. But the surprising part is what happens when you stop treating ping output as text.
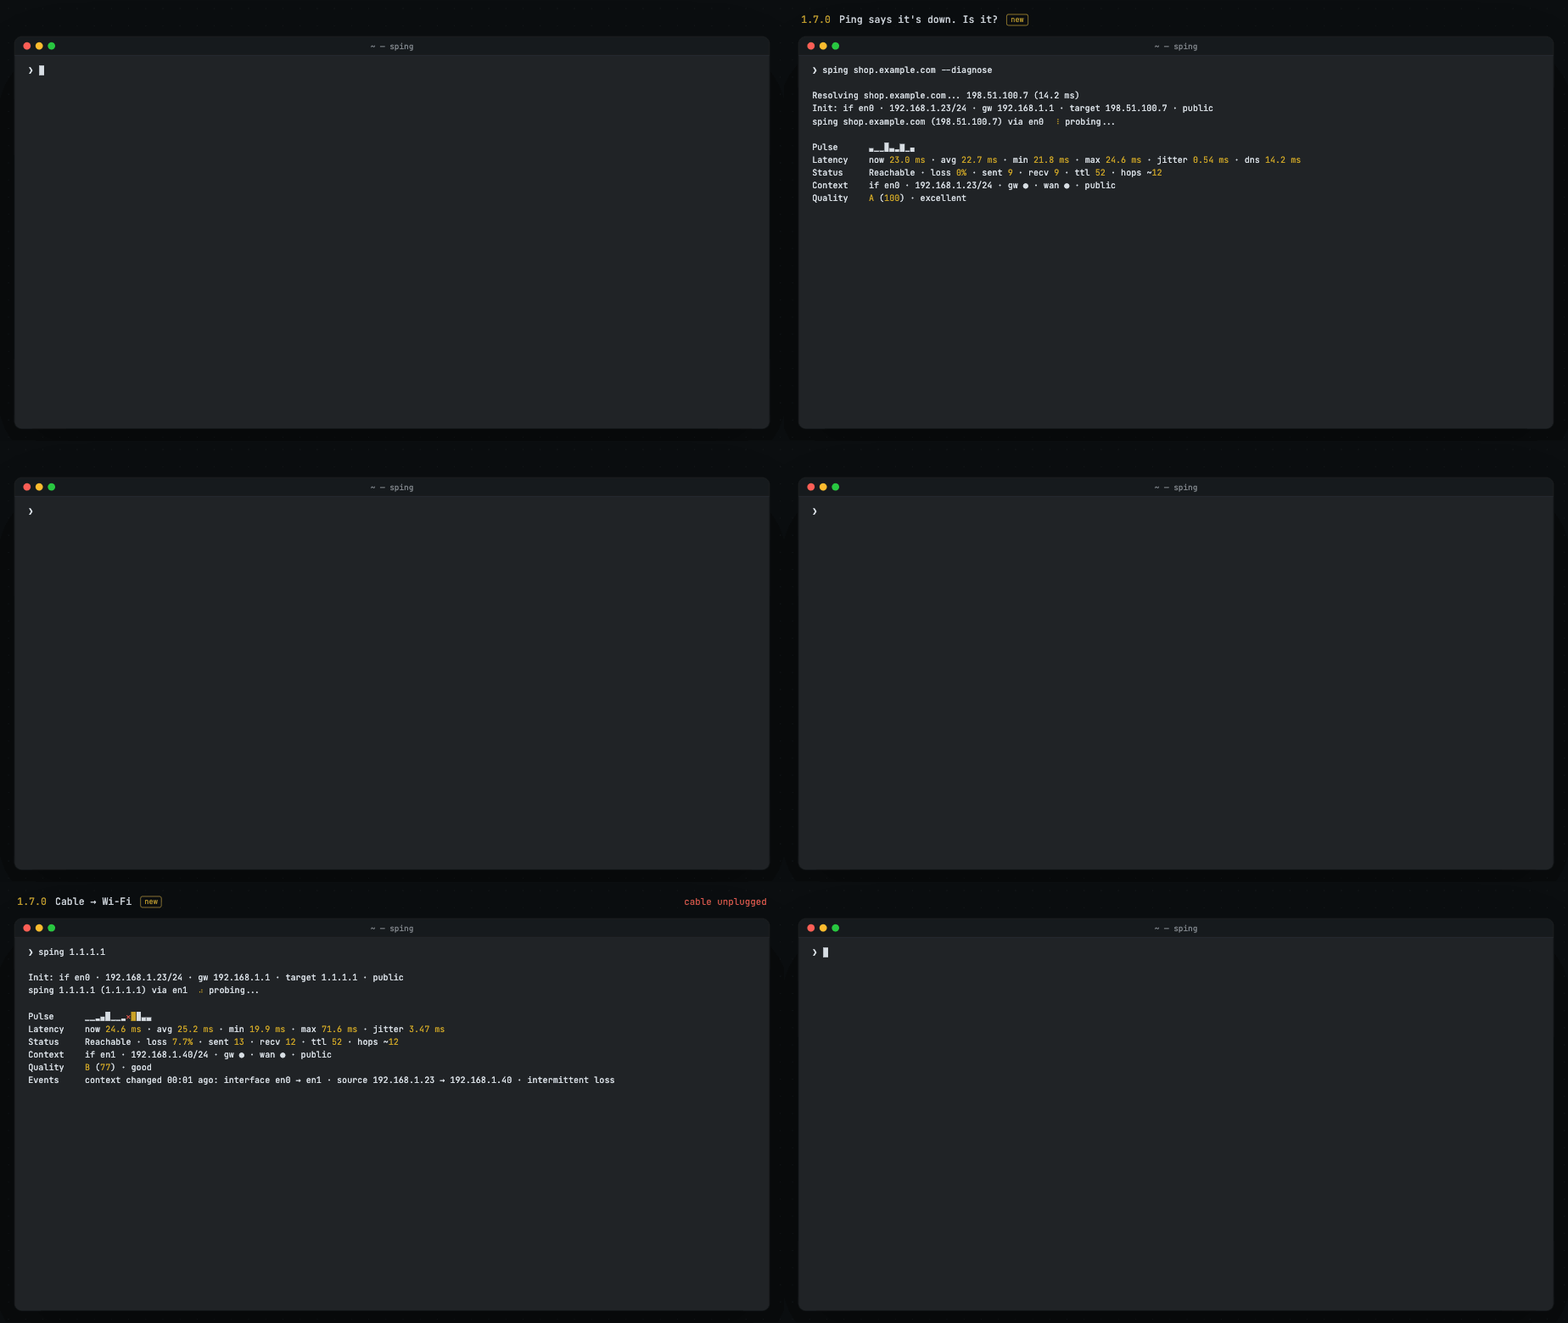
The trick: JSON instead of lines of ping output
A regular monitoring session can stream newline-delimited JSON (NDJSON):
sping example.com --view json
Each line is a new measurement, with fields such as rttavg, losspct, jitter, quality, trend, and—when available—network context and diagnostic findings.
For a list of machines, there's a different mode:
sping --batch hosts.txt -c 10 --view json -o fleet.ndjson
One final JSON object per target. The targets are probed in parallel, with 10 probes each. The result isn't a screenshot or an unstructured log; it's data you can filter, compare, archive, and analyze.
Here are five things you can do with it.
1. Turn an Ansible inventory into a network health report
Ansible already knows which machines exist. Let's reuse that information.
If you have an INI or YAML inventory, use ansible-inventory to resolve it into a plain host list. This example prefers ansible_host when an alias points to a different address:
ansible-inventory -i inventory.ini --list \
  | jq -r '._meta.hostvars | to_entries[] | (.value.ansible_host // .key)' \
  | sort -u > hosts.txt

sping --batch hosts.txt -c 10 --view json -o fleet.ndjson
That's your inventory transformed into a network snapshot. No agent to install on every machine, no dashboard to deploy.
If you already maintain a text file containing one IP or hostname per line, skip the Ansible step and pass it straight to --batch.
2. Show only the machines that need attention
Now for the useful part. Rather than reading everything, ask jq for machines with no replies or at least 20% packet loss:
jq -r '
  select(.sent == 0 or .received == 0 or .loss_pct >= 20) |
  "\(.target_host): \(.received)/\(.sent) replies, \(.loss_pct)% loss"
' fleet.ndjson
Suddenly, a long inventory becomes a short list to investigate.
Want to make this part of a deployment preflight? Check TCP instead of ICMP, especially on networks where ping is filtered:
status=0
sping --batch hosts.txt --tcp 22 -c 3 --view json -o ssh.ndjson || status=$?
[ "$status" -le 1 ] || exit "$status"

jq -s -e --argjson expected "$(wc -l < hosts.txt)" '
  length == $expected and
  all(.[]; .sent == 3 and .received == 3 and (.refused // 0) == 0)
' ssh.ndjson
That last command exits unsuccessfully unless every expected host answered all three TCP attempts on port 22 without a refusal.
A TCP refusal is still a network response, but it doesn't mean SSH is accepting connections. And an open TCP port doesn't guarantee a successful login. This is a connectivity gate, not an application health check.
Operational detail: sping may skip hostnames that fail DNS resolution (and warn on stderr), so compare the number of JSON records to the expected host count. The preflight above does exactly that. In batch mode, sping can also return exit code 1 when a host receives no replies; that isn't the same as a CLI/runtime error (2).
3. Compare the network before and after a change
Ever changed a firewall rule, VPN, switch, or routing policy and then wondered which machines became worse?
Keep two snapshots:
# Before the change
sping --batch hosts.txt -c 10 --view json -o before.ndjson

# After the change
sping --batch hosts.txt -c 10 --view json -o after.ndjson
Then show the hosts whose packet-loss percentage increased:
jq -n -r \
  --slurpfile before before.ndjson \
  --slurpfile after after.ndjson '
  ($before | map({key: .target_host, value: .loss_pct}) | from_entries) as $old |
  $after[] |
  select($old[.target_host] != null and .loss_pct > $old[.target_host]) |
  "\(.target_host): \($old[.target_host])% -> \(.loss_pct)% loss"
'
You can do the same with average latency or jitter. A before/after report turns a vague "the network feels worse" into something you can investigate. It's an observation from the machine running sping, not proof of what caused the change.
4. Give an AI evidence instead of a screenshot
This is the part I find especially interesting.
Don't ask an AI to guess whether your infrastructure is healthy. Give it a small, structured report with actual measurements:
jq -s '[.[] | {
  host: .target_host,
  ip: .target_ip,
  sent, received, loss_pct, rtt_avg, jitter,
  quality, trend,
  diagnosis: (.diagnosis // [])
}]' fleet.ndjson > ai-report.json
Now paste ai-report.json into an AI assistant, or pass it to a local model, with a prompt like:
Group these hosts by symptoms. Prioritize which ones I should investigate first. Highlight total loss, intermittent loss, high latency, and consistent patterns. State what the data doesn't prove. Don't assume an ICMP timeout means the server is down. Suggest the next checks, based only on the supplied measurements.
That's the workflow I find exciting:
Ansible inventory → sping → NDJSON → deterministic filters → AI-assisted triage.
The AI isn't doing the network measurements. sping is. The model helps you organize and interpret the evidence.
If hostnames or internal IP addresses are sensitive, redact them or use a trusted local model before sharing the report.
5. Drill into one suspicious host with --diagnose
Batch mode answers which machines deserve a closer look. For a single problematic endpoint, sping 1.8.0 has an experimental follow-up mode:
sping example.com --diagnose -c 10 --view json > incident.ndjson
When the target stops answering, sping can try additional checks: alternative IPv4/IPv6 connectivity, TCP ports 443 and 80, and a bounded traceroute. Then you can inspect the additional findings:
jq -s '.[-1] | {
  target: .target_host,
  diagnosis: (.diagnosis // []),
  active_diagnosis: .active_diagnosis,
  gateway: .gateway,
  wan: .wan
}' incident.ndjson
The distinction matters: silence isn't proof of a firewall, and a successful TCP response isn't proof that the application is healthy. --diagnose reports observations, including checks it couldn't complete. It's experimental, single-target only, and intentionally separate from --batch.
The bigger idea
I didn't want sping to be just a prettier ping.
I wanted a tool that's useful when you're looking at a terminal and when nobody is looking at the terminal: in scripts, CI jobs, inventory audits, incident reports, or an AI-assisted troubleshooting workflow.
The terminal UI is for humans. The JSON is for everything you might build around it.
sping runs on Linux, macOS, and Windows. It's open source, MIT-licensed, and doesn't require a cloud service.
A small milestone: sping is now in Debian!
Update (October 2026): sping 1.8.0 has officially joined Debian unstable (sid), thanks to the Debian Rust Team and Simon Quigley's sponsorship.
If you're running Debian sid, you can install it directly:
sudo apt install sping
You can follow the package on the Debian Package Tracker.
Want to try sping?
If you have Rust 1.88+ installed, you can get started with:
cargo install sping
sping 1.1.1.1
Or download a prebuilt binary for your platform.
If you find sping useful, feedback and contributions are always welcome. And if you like the project, a ⭐ on GitHub helps others discover it!
I'd love to hear what you'd build with it. What network check do you still run manually that should really be a script?