In virtually every corporate strategic planning retreat, quarterly Board of Directors meeting, or M&A investment committee session, the exact same slide is inevitably projected: the canonical four quadrants of the BCG Growth-Share Matrix—Stars, Cash Cows, Question Marks, and Dogs.
Yet in more than 80% of corporate enterprises, this strategic framework falls prey to a systemic executive failure known in Tier-1 management consulting as the "Static Sketch Syndrome":
- The Fatal Confusion Between Absolute and Relative Market Share (RMS): An executive committee complacently designates a business unit as a "market leader" simply because it commands a 28% market share. However, if the primary market incumbent commands 56%, the firm's relative share is merely
0.50x. In the real economics of scale, an RMS of 0.50x means the competitor has accumulated double the production experience, operating with structural unit cost advantages driven by the Experience Curve. The firm's business unit is not a leader; it is an endangered sub-scale competitor.
- Total Disconnect from Free Cash Flow (FCF) and the Balance Sheet: Bruce Henderson's original framework, published in 1968 for the Boston Consulting Group, was never conceived as a marketing taxonomy or branding matrix; it was engineered as a mathematical corporate liquidity allocation model. Evaluating business units without calculating their net free cash flow (
FCF) or auditing their working capital and expansion CAPEX requirements reduces strategic planning to decorative rhetoric.
- The Sunk-Cost Trap of "Viable Dogs": Corporate management routinely tolerates the indefinite survival of sub-scale Dogs simply because they produce a modest positive accounting profit or EBITDA margin (e.g. 4% on sales). Executive leadership overlooks the capital opportunity cost: the Return on Invested Capital (
ROIC) of that unit is significantly lower than the company's Weighted Average Cost of Capital (WACC), meaning that every dollar retained in that line destroys shareholder value.
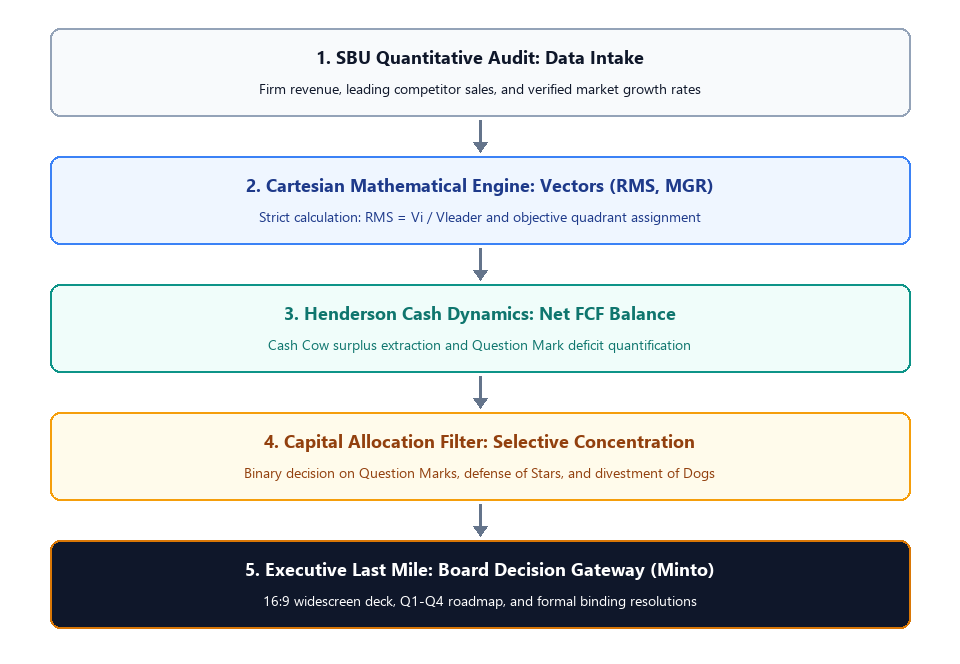
To elevate the BCG matrix into an actionable, boardroom-grade decision engine, corporate strategy must formalize the analysis into an objective Cartesian model of Relative Market Share (RMS) vs. Market Growth Rate (MGR), simulate Bruce Henderson's corporate cash flow balance, project an executive bubble chart scaled by revenue, and deliver a Minto Pyramid-structured capital reallocation plan.
1. What is the BCG Matrix? Fundamentals, Portfolio Dynamics & Core Objectives
For Chief Executive Officers (CEOs), Chief Financial Officers (CFOs), private equity investment directors, and corporate strategists tasked with steering multi-business enterprises—or anyone approaching this framework for the first time—the BCG Growth-Share Matrix (originally developed by Bruce D. Henderson in 1968 and formalized in his landmark 1970 essays for the Boston Consulting Group) represents the foundational discipline for corporate portfolio management and executive capital allocation.
Unlike diagnostic frameworks focused narrowly on single product lines or functional operational efficiencies, the BCG Matrix is rooted in an indisputable corporate finance reality: in a diversified enterprise, not all business units share the same lifecycle stage, nor should they be governed by identical financial hurdles. Applying uniform dividend payout expectations or identical return targets to an emerging unit in a nascent, capital-hungry market as one does to a mature cash generator inevitably chokes off enterprise innovation; conversely, permitting mature businesses to reinvest their discretionary cash flows into low-growth sectors guarantees systemic capital destruction.
The Model Architecture: The 4 Strategic Portfolio Quadrants
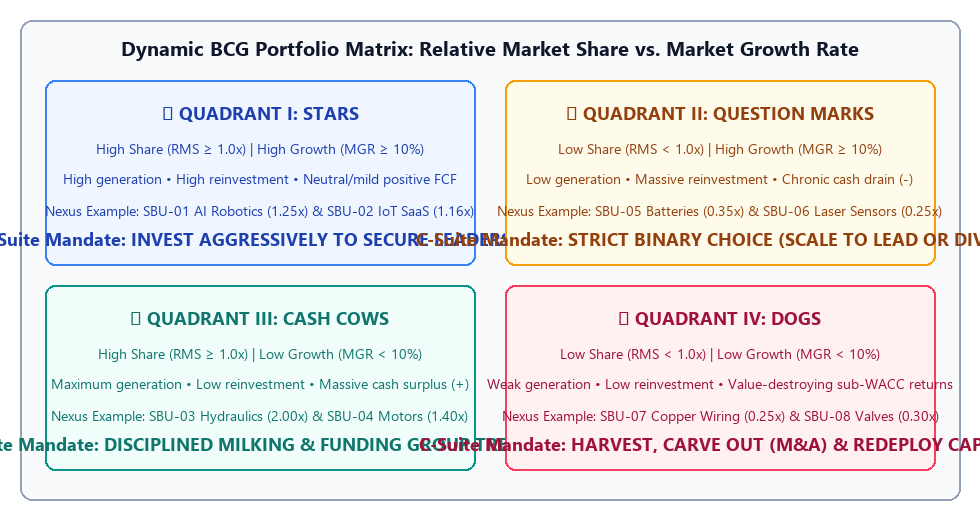
The framework evaluates each Strategic Business Unit (SBU) within a Cartesian space intersecting two structural variables: Relative Market Share (RMS) on the horizontal axis and Market Growth Rate (MGR) on the vertical axis:
| BCG Quadrant | Relative Position (RMS / MGR) | Cash Flow & Operating Dynamics | Gross Cash Generation vs. Reinvestment Demands | C-Level Strategic Mandate | Prototypical Business Example |
|---|
| ⭐ STARS | High RMS (≥ 1.0x)
High Growth (≥ 10%) | Market leader in an expanding sector. Commands superior gross margins via scale economics, but requires heavy capital reinvestment to defend leadership. | High Generation • High Reinvestment
Net Free Cash Flow (FCF) roughly neutral or mildly positive. | Invest aggressively: Fund capacity scale-up, channel expansion, and R&D moats to entrench market leadership before industry maturity. | Leading enterprise SaaS platforms in hypergrowth or autonomous AI robotics divisions. |
| 🐄 CASH COWS | High RMS (≥ 1.0x)
Low Growth (< 10%) | Scale-driven cost leader in a mature or low-growth sector. Generates massive operating cash well beyond internal reinvestment needs. | Maximum Generation • Low Reinvestment
Massive structural net cash surplus (FCF >> 0). | Disciplined milking: Cap capital allocation to sustaining maintenance; systematically remit excess cash to group treasury. | Heavy hydraulic power systems, established industrial diesel engines, or legacy branded consumer staples. |
| ❓ QUESTION MARKS | Low RMS (< 1.0x)
High Growth (≥ 10%) | Sub-scale follower in a rapidly expanding sector. Suffers operating cost penalties against the incumbent and burns cash to keep pace. | Low Generation • Massive Reinvestment
Severe, chronic free cash flow deficit (FCF << 0). | Strict binary decision: Concentrate Cash Cow surplus to cross RMS ≥ 1.0x or divest/carve out immediately. | Solid-state energy storage cells competing against entrenched global battery conglomerates. |
| 🐕 DOGS | Low RMS (< 1.0x)
Low Growth (< 10%) | Sub-scale competitor in a stagnant or contracting sector. Depressed operating margins and trapped working capital delivering sub-WACC returns. | Weak Generation • Low Reinvestment
Net cash flow near zero or an active, persistent cash drain. | Harvest or divest (M&A): Carve out to consolidating rivals, liquidate inventory, and redeploy capital into Stars. | Uninstrumented analog valves, conventional copper wiring harnesses, or obsolete peripheral hardware. |
How It Works: The Strategic Planning Funnel (PESTEL → Porter → SWOT-TOWS → BCG Matrix)
In Tier-1 strategy consulting practice (McKinsey, BCG, Bain), strategic formulation never relies on disconnected tools; it operates as an integrated four-stage analytical funnel:
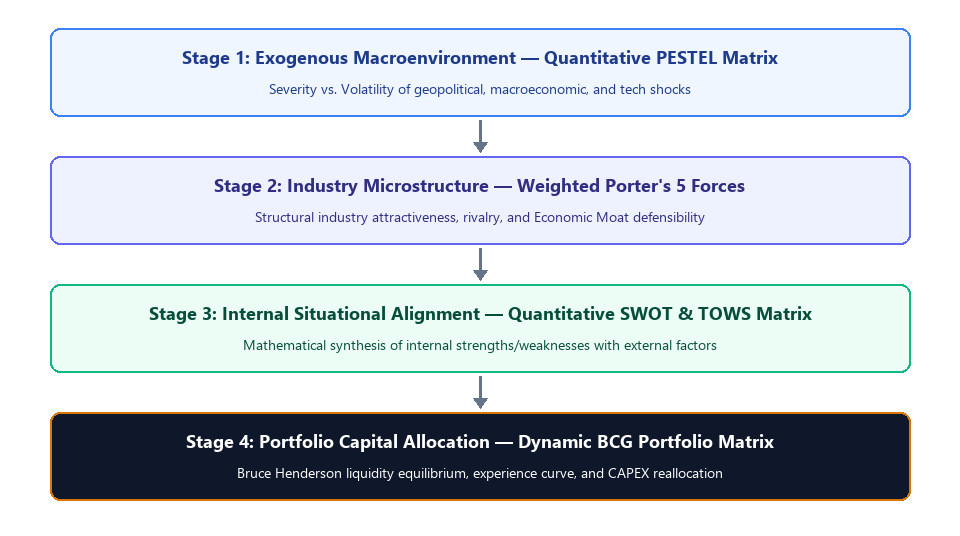
- Stage 1 — Exogenous Macroenvironmental Scanning (Quantitative PESTEL Matrix): The macro radar. It identifies and quantifies the P&L impact severity and temporal volatility of statutory shifts, energy price shocks, interest rate cycles, and demographic trends.
- Stage 2 — Structural Industry & Value Chain Analysis (Weighted Porter's 5 Forces & Industry Attractiveness): Evaluates industry profitability. It examines buyer/supplier bargaining power, barriers to entry, and structural spread (
ROIC − WACC).
- Stage 3 — Situational Alignment & Strategic Posture (Quantitative SWOT & TOWS Matrix): Synthesizes external risks/opportunities from PESTEL and Porter with internal organizational capabilities, defining the firm's strategic posture and triggering actionable initiatives inside the TOWS matrix.
- Stage 4 — Portfolio Capital Allocation & Liquidity Dynamics (Dynamic BCG Matrix): The apex of corporate finance governance. An enterprise operating across multiple business units must answer the Board's ultimate question: where does our cash originate, and where must it be deployed to maximize long-term enterprise value? The BCG Matrix choreographs this transfer: mature Cash Cows remit surplus liquidity to fund selected Question Marks pursuing prime opportunities validated in the SWOT.
2. Mathematical Foundations: Relative Market Share & The Experience Curve
To eliminate qualitative ambiguity, our framework formalizes each Strategic Business Unit (SBU) into a two-dimensional vector mapped onto Cartesian space:
2.1. Relative Market Share Equation (RMS_i)
Relative Market Share is the governing metric of the horizontal axis. Unlike absolute share, it measures the SBU's scale directly against the primary market incumbent:
RMS_i = Vi / V(leader, i)
Where:
V_i: Annual revenue or unit sales volume of evaluated SBU i.V_(leader, i): Annual revenue of the number one competitor in that specific market segment.- Inversion Rule for the Market Leader: If the firm's SBU is already the number one player in the sector, relative share is calculated against the second-largest competitor (
RMS_i = V_i / V_(second, i)), resulting in an RMS > 1.00x.
The Canonical Hurdle: Universally established at RMS = 1.00x. An RMS ≥ 1.00x indicates market leadership and, consequently, the lowest unit operating cost in the industry. An RMS < 1.00x signals a structural cost disadvantage.
2.2. Market Growth Rate Equation (MGR_i)
The vertical axis measures the annualized rate at which the total addressable market expands:
MGRi = [ (M(i, t) − M(i, t-1)) / M(i, t-1) ] × 100%
Where M_(i, t) represents total market sales volume in year t. The standard benchmark is set at MGR = 10.0% annually (or nominal GDP growth plus sector inflation).
2.3. Bruce Henderson's Experience Curve
The corporate finance link between Relative Market Share and operating margin is the Experience Curve, empirically established by BCG in 1968:
C_n = C_1 · n^(-b)
Where:
C_n: Real unit cost of value-added after producing cumulative unit n.C_1: Real unit cost of the first unit produced.n: Total cumulative production volume over company history.b: Learning elasticity coefficient (b > 0).
The elasticity b derives directly from the industry's Progress Ratio (PR) (typically between 70% and 80% in advanced manufacturing, automotive, robotics, and software):
b = −ln(PR) / ln(2)
For an 80% progress ratio (PR = 0.80), b = −ln(0.80) / ln(2) ≈ 0.322. This dictates that every time cumulative production volume doubles, real unit costs decline by 20%. Because the leader (RMS ≥ 1.0x) produces at a higher volume than any competitor, it descends the cost curve faster, locking in structural EBITDA advantages.
2.4. Net Free Cash Flow Equation (FCF)
Cash flow dynamics across quadrants are governed by the standard corporate Free Cash Flow equation:
FCF_i = EBITDA_i · (1 − t) − ΔNWCi − CAPEX(maintenance, i) − CAPEX_(growth, i)
- In high-growth sectors (
MGR ≥ 10%), CAPEX_growth and working capital (ΔNWC) requirements are massive to fund new production capacity and inventory.
- In low-growth sectors (
MGR < 10%), CAPEX_growth ≈ 0 and working capital is stable (ΔNWC ≈ 0), unlocking massive discretionary cash flow.
3. Bruce Henderson's Golden Rules of Capital Allocation
Henderson demonstrated that the four quadrants are interconnected stages of an enterprise lifecycle governed by cash transfers:
3.1. The Virtuous Portfolio Cycle
- Cash Cows fund the future: Mature Cash Cows generate recurring cash surpluses that cannot be profitably reinvested in their own low-growth markets without creating destructive excess capacity.
- Selective Question Mark concentration: Cash Cow surpluses are channeled exclusively into one or two high-potential Question Marks to fund the capacity scale-up and commercial footprint required to overtake the market leader.
- Emergence of new Stars: Once a Question Mark crosses
RMS ≥ 1.00x, it becomes a self-funding Star.
- Generational Cash Cow replenishment: As sector growth naturally decelerates below 10%, the Star transitions into a Cash Cow, securing group dividend capacity for the following decade.
3.2. Bruce Henderson's 4 Capital Allocation Traps
- Trap 1: Starving the Cows: Starving Cash Cows of necessary maintenance CAPEX. Operating quality declines, customers defect, and
RMS drops below 1.0x, degrading them prematurely into Dogs.
- Trap 2: Feeding the Dogs: Bowing to organizational politics or emotional attachment by funding capital increases in low-share businesses within stagnant sectors. Every dollar given to a Dog is capital stolen from a scaling Star.
- Trap 3: Scattering Capital across Question Marks: Dividing capital democratically across four or five Question Marks. None achieve the critical mass to overtake the leader, and all eventually degrade into Dogs.
- Trap 4: Portfolio Aging: Holding a portfolio consisting exclusively of Cash Cows and Dogs. While cash flow looks strong today, the enterprise has no pipeline of future Stars when legacy sectors decline.
4. Henderson's Net Fund Balance Equation (NBF)
To audit group cash sustainability, our model computes the Net Fund Balance (NBF):
NBF = Σ FCF(Cash Cows) + Σ FCF(Stars) − Σ |FCF(Question Marks)| − Σ |FCF(Deficit Dogs)|
- If NBF > 0 (Structural Surplus): The portfolio is self-funding, generating surplus liquidity for shareholder dividends, debt deleveraging, or opportunistic M&A.
- If NBF < 0 (Structural Deficit): The portfolio burns more cash than it produces internally, forcing leadership to take on bank debt or dilute equity to fund business expansion.
5. Industrial B2B Case Study: Nexus Industrial Technologies Group
To demonstrate this methodology in a boardroom setting, we examine an anonymized mid-market diversified industrial group (Nexus Group).
5.1. Baseline Financials
- Consolidated Annual Revenue: €107.0M
- Consolidated EBITDA: €18.98M (Average EBITDA Margin: 17.7%)
- Net Free Cash Flow (FCF): +€5.29M
- Portfolio Scope: 8 Strategic Business Units (SBUs) operating across advanced robotics, enterprise SaaS, industrial power, and legacy manufacturing.
5.2. Quantitative SBU Audit (Datalaria Engine)
| SBU ID | Business Unit Name | SBU Revenue (V_i) | Leader Sales (V_leader) | Relative Share (RMS) | Market Growth (MGR) | EBITDA Margin | EBITDA Generated | Net Annual FCF | BCG Quadrant |
|---|
| SBU-01 | Autonomous AI Robotics | €18.5M | €14.8M | 1.25x | +18.5% | 22.0% | €4.07M | +€0.65M | ⭐ STAR |
| SBU-02 | Industrial IoT SaaS Platform | €12.2M | €10.5M | 1.16x | +24.0% | 25.0% | €3.05M | +€0.28M | ⭐ STAR |
| SBU-03 | Hydraulic Power Systems | €32.0M | €16.0M | 2.00x | +3.5% | 20.0% | €6.40M | +€4.85M | 🐄 CASH COW |
| SBU-04 | Industrial Combustion Engines | €24.5M | €17.5M | 1.40x | +2.0% | 18.0% | €4.41M | +€3.20M | 🐄 CASH COW |
| SBU-05 | Solid-State Energy Storage | €6.5M | €18.5M | 0.35x | +32.0% | 6.0% | €0.39M | -€2.15M | ❓ QUESTION MARK |
| SBU-06 | Quantum Laser Sensing | €3.8M | €15.2M | 0.25x | +21.0% | 4.0% | €0.15M | -€1.45M | ❓ QUESTION MARK |
| SBU-07 | Conventional Copper Wiring | €5.2M | €20.8M | 0.25x | +1.0% | 5.0% | €0.26M | -€0.18M | 🐕 DOG |
| SBU-08 | Legacy Pneumatic Valves | €4.3M | €14.3M | 0.30x | -1.5% | 7.0% | €0.30M | +€0.09M | 🐕 DOG |
| TOTAL | CONSOLIDATED PORTFOLIO | €107.0M | - | 1.09x | +8.2% | 17.7% | €18.98M | +€5.29M | BALANCED |
5.3. Financial Diagnosis & Henderson Cash Dynamics
The quantitative model revealed three critical strategic insights:
- Severe Cash Cow Concentration: 52.8% of group revenue (€56.5M) and 75% of EBITDA are concentrated in two mature divisions (Hydraulics and Engines) growing below 3.5%. Without portfolio renewal, corporate cash flow would drop 35% within 7 years.
- Robust Cash Surplus: The two Cash Cows generate +€8.05M in net annual FCF, easily covering the combined deficit of the two Question Marks (-€3.60M) with a residual surplus of +€4.45M.
- Hidden Capital Destruction in Dogs: The two Dogs tie up €9.5M in sales and over €2.8M in working capital, yielding an average ROIC of 4.2% against an 8.5% group WACC.
5.4. Boardroom Capital Allocation Plan Approved
The Board of Directors approved a 4-Pillar Capital Reallocation Roadmap:
- Pillar 1: Concentrated Injection in Energy Storage (SBU-05 — €2.8M CAPEX): €2.8M from Hydraulic Power surpluses deployed to triple automated assembly capacity, lifting
RMS from 0.35x to 1.05x within 18 months (transforming it into a new Star).
- Pillar 2: 50% Joint Venture in Quantum Laser Sensing (SBU-06): To prevent capital dilution, leadership negotiated a co-investment with an industrial partner, eliminating the €1.45M annual cash drain.
- Pillar 3: M&A Carve-Out of Copper Wiring (SBU-07 — €3.2M Proceeds): Formal sales mandate issued to divest equipment and inventory to a regional competitor for €3.2M cash.
- Pillar 4: Phased Harvest and Closure of Legacy Valves (SBU-08): Orderly inventory liquidation during Q3, reallocating 14 specialized mechanical engineers to AI Robotics (SBU-01).
Projected Financial Return: Corporate ROIC expanded from 16.0% to 19.2% (+320 basis points), projected annual EBITDA increased by €4.45M, and capital payback was achieved in 18.2 months.
For Chief Executive Officers (CEOs), Chief Financial Officers (CFOs), corporate strategy directors, and private equity partners looking to deploy this Tier-1 consulting standard (McKinsey / BCG) without building the mathematical engine from scratch, we have packaged the complete official toolkit in our resource library:
⭐ Executive Kit: Dynamic BCG Portfolio Matrix & Capital Allocation (Excel + PPTX + PDF)
The implementation package includes all interconnected programmatic assets ready for the boardroom:
- Automated Excel Engine (
.xlsx): 4 interconnected tabs featuring automated Relative Market Share (RMS = Vi / Vleader), Market Growth Rate (MGR), dynamic revenue-scaled bubble chart, and Bruce Henderson's Net Fund Balance (NBF). 100% compatible with Microsoft Excel and Google Sheets.
- 2D Cartesian Portfolio Matrix: Automated classification across Stars, Cash Cows, Question Marks, and Dogs with expected return spread mapping (
ROIC − WACC).
- Executive PowerPoint Deck (
.pptx 16:9 Widescreen): Editable C-Suite slides structured under the Minto Pyramid Principle, complete with Action Titles, bubble scatter plots, and a Board Decision Gateway.
- Official Methodological Guide in PDF (5 pages): Mathematical proofs of the Experience Curve, solved industrial case study, and Board of Directors FAQ.
👉 Access the complete Executive Kit and quantitative toolkits at Datalaria Resources
7. Boardroom Defense Protocol (C-Suite FAQ)
Why divest a Dog that still generates positive accounting EBITDA?
Because accounting profit ignores the cost of capital. If a division generates €90,000 of EBITDA on €2,500,000 of invested assets, its Return on Invested Capital (ROIC) is only 3.6%. If corporate WACC is 8.5%, the unit destroys €122,500 of shareholder value every single year. Divesting those assets for €3.2M and redeploying into a Star generating 22% yields immediate enterprise value creation.
How do we select which Question Mark to fund with Cash Cow surpluses?
By applying three sequential quantitative filters:
- Scale Feasibility (
RMS ≥ 1.0x): Mathematically demonstrable runway to overtake the incumbent before market maturation.
- Capital Intensity: CAPEX required to double market share relative to available Cash Cow surpluses.
- Growth Runway: Assurance that market growth (
MGR) will remain above 10% for at least 4 years to amortize expansion capital.
How do we prevent Cash Cow leadership fatigue?
By disconnecting executive bonuses from revenue growth (an inappropriate metric for mature markets) and tying 100% of incentives to Net Free Cash Flow (FCF) generation, Working Capital (NWC) efficiency, and market share preservation. Cash Cow leaders must be celebrated as the foundational guarantors of enterprise solvency and dividends.
8. Authoritative Canonical References
- Henderson, Bruce D. (1970). The Product Portfolio. Boston Consulting Group Perspectives, No. 66, Boston. View original perspective at bcg.com
- Henderson, Bruce D. (1968). The Experience Curve. Boston Consulting Group, Boston. ISBN:
978-0878460656
- Day, George S. (1977). "Diagnosing the Product Portfolio". Journal of Marketing, Vol. 41, No. 2, pp. 29-38. DOI:
10.1177/002224297704100206
- Porter, Michael E. (1980). Competitive Strategy: Techniques for Analyzing Industries and Competitors. Free Press, New York. ISBN:
978-0684841489
- Minto, Barbara (2009). The Pyramid Principle: Logic in Writing and Thinking. Financial Times / Prentice Hall (3rd Edition). ISBN:
978-0273710516
- McKinsey & Company, Koller, T., Goedhart, M., & Wessels, D. (2012). Valuation: Measuring and Managing the Value of Companies. John Wiley & Sons, New York. ISBN:
978-0470427774
If you found this quantitative framework useful, explore more executive engineering and corporate strategy toolkits at www.datalaria.com.