TL;DR.
A monitoring alert said I was dropping check results. The disk was 100% full. My actual data was 20 MB. ClickHouse had quietly written 12 GB of logs about itself, mostly system.text_log and system.trace_log. Those same logs also burn CPU at idle. The fix is a few lines of ClickHouse config that disable the noisy logs and slow the metrics collector. Full config is below.
The alert
One morning a critical alert fired: UptimepageResultsLost. Its description is blunt: storage write failures or dropped results, checks run but results are not persisting. Then it did something worse than fire once. It cleared, fired again, cleared, and fired again, over and over.
I run Uptimepage, an uptime monitoring service. "Results not persisting" means the one thing customers pay for, recording whether their sites are up, might be failing. So it had my full attention.
The good news first: no data was lost. The write path retries, and every failed write was caught by a retry. I keep a counter for results that actually get dropped, and it stayed at zero the whole time. But something was clearly wrong underneath.
The real signal: a full disk
The first real signal came from Postgres, which had crashed and restarted a couple of minutes earlier:
FATAL: could not write lock file "postmaster.pid": No space left on device
The disk was 100% full. Postgres could not write its lock file, crashed, and recovered on its own through WAL replay. ClickHouse, where I store raw check results, was rejecting inserts with its own version of the same complaint:
Code: 243. DB::Exception: Cannot reserve 1.00 MiB, not enough space:
While executing WaitForAsyncInsert. (NOT_ENOUGH_SPACE)
So the alert was a symptom. The real problem was a full disk. That reframes the question: I do not store much, so what filled it?
Leak one: old Docker images
docker system df gave the first half of the answer:
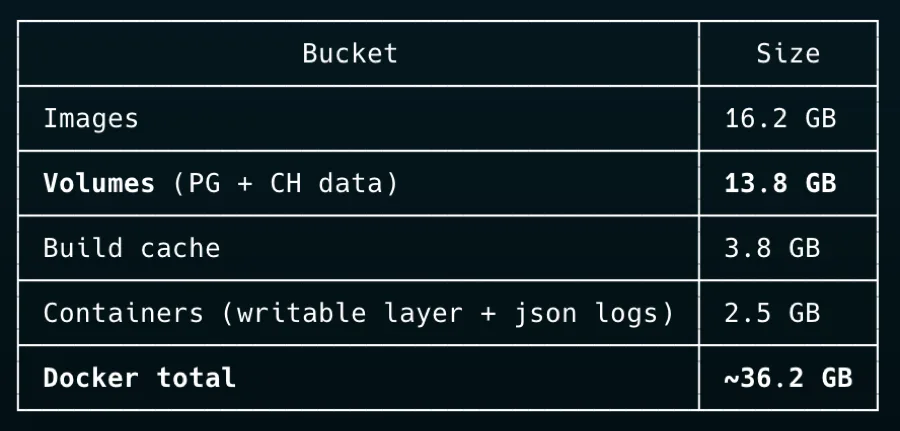
88 Docker images, only two of them in use. Every deploy pulls a fresh image, and nothing pruned the old ones, so they piled up for weeks. A docker image prune -af reclaimed about 10 GB and took the disk off the ceiling.
That stopped the bleeding. But 13.8 GB of volumes is a lot for a service whose data I thought was tiny. That number turned out to be the real story.
Leak two: ClickHouse logging about itself
I went into ClickHouse and asked the obvious question, which table is big:
SELECT database, formatReadableSize(sum(bytes_on_disk)) AS size, sum(rows) AS rows
FROM system.parts
WHERE active
GROUP BY database
ORDER BY sum(bytes_on_disk) DESC
The answer stopped me:
| Database | Size | Rows |
|---|
system | 11.8 GiB | 577,340,927 |
monitor | 19.7 MiB | 1,813,884 |
monitor is my data: every check result and rollup I keep. About 20 MB. The system database, ClickHouse's own diagnostic tables, was 11.8 GiB. Nearly all of the storage was ClickHouse logging about itself.
Breaking system down by table:
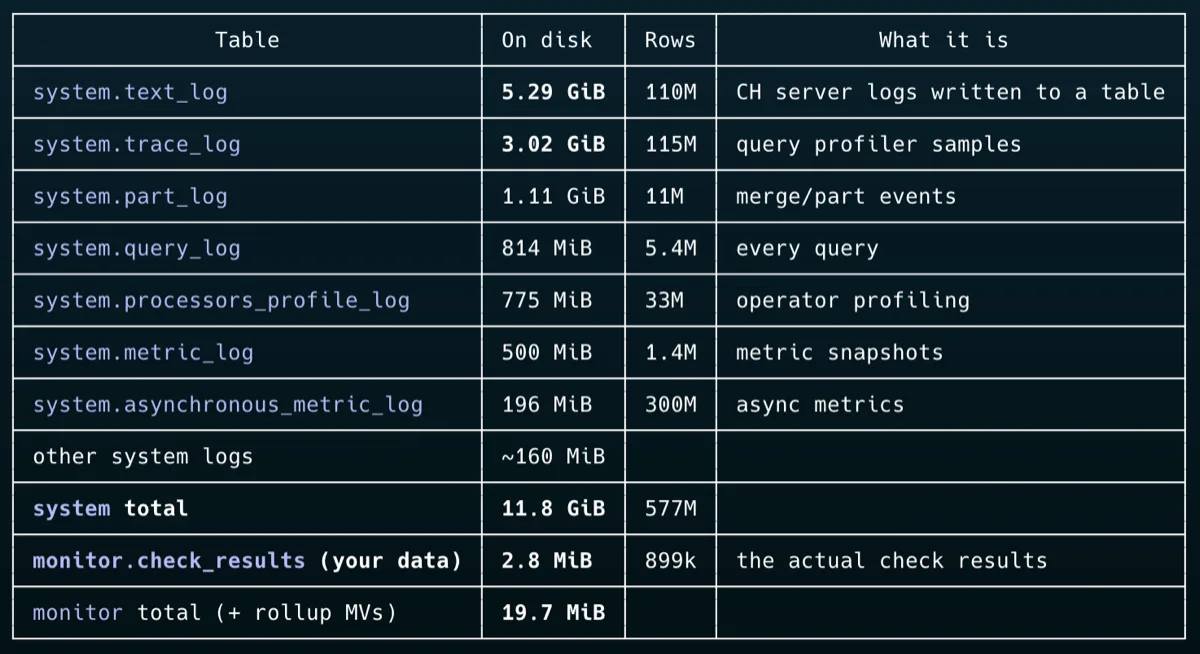
Two tables did most of the damage. system.text_log (5.29 GiB) is a copy of the server's own log output written into a table. system.trace_log (3.02 GiB) is the query profiler, which samples running queries. Both are handy when you are actively debugging ClickHouse. Neither is worth multiple gigabytes when I am not. And text_log is off by default, so something in my setup had switched it on.
The fix
Two parts: reclaim the space now, and stop it coming back.
Reclaim now. The system log tables are throwaway diagnostics, not real data. Truncate them:
TRUNCATE TABLE IF EXISTS system.text_log;
TRUNCATE TABLE IF EXISTS system.trace_log;
-- and the rest of the system.*_log tables
That gave back 12 GB at once and took the disk from 74% down to 41%.
Stop the regrowth. Truncating is a one-time cleanup. Without a cap, the logs fill right back up. The durable fix is ClickHouse config, added under /etc/clickhouse-server/config.d/. I watch ClickHouse through Grafana, not these tables. So I disable almost all of them and keep only query_log and part_log, both bounded, for the rare hands-on debugging session:
<clickhouse>
    <!-- Sample async metrics every 60s, not every second. -->
    <asynchronous_metrics_update_period_s>60</asynchronous_metrics_update_period_s>

    <!-- Disable the log tables. remove="1" on an absent table is a no-op,
         so this list is safe to paste as-is across ClickHouse versions. -->
    <asynchronous_metric_log remove="1"/>
    <asynchronous_insert_log remove="1"/>
    <backup_log remove="1"/>
    <error_log remove="1"/>
    <crash_log remove="1"/>
    <metric_log remove="1"/>
    <query_metric_log remove="1"/>
    <query_thread_log remove="1"/>
    <query_views_log remove="1"/>
    <session_log remove="1"/>
    <text_log remove="1"/>
    <trace_log remove="1"/>
    <opentelemetry_span_log remove="1"/>
    <zookeeper_log remove="1"/>
    <processors_profile_log remove="1"/>
    <latency_log remove="1"/>
    <background_schedule_pool_log remove="1"/>

    <!-- Keep query_log and part_log, bounded, for on-hand debugging. -->
    <query_log>
        <ttl>event_date + INTERVAL 3 DAY DELETE</ttl>
        <max_size_rows>1048576</max_size_rows>
    </query_log>
    <part_log>
        <ttl>event_date + INTERVAL 3 DAY DELETE</ttl>
        <max_size_rows>1048576</max_size_rows>
    </part_log>
</clickhouse>
remove="1" disables a system log completely. The <ttl> element on query_log and part_log adds a TTL and keeps the table's default partitioning, so you do not have to restate the whole engine. ClickHouse picks up the change after a restart. Altinity's "system tables ate my disk" note covers the same ground and is worth a read. If you would rather keep the diagnostics, give every log a short <ttl> instead of disabling it.
Bonus: lower CPU, not just disk
Those log tables are written constantly, and on a small server that steady write load shows up as CPU. A long-running ClickHouse issue tracks the server using noticeable CPU at zero load, #60016. People there report dropping from 40 to 70% CPU down to about 1.5% after disabling the logs and slowing the async-metrics collector. So those two settings, the asynchronous_metrics_update_period_s line and the remove="1" block, pay off twice: less disk and less CPU.
The real lesson: alert on the cause, not the effect
Here is the part that stings. I had an alert for "results are being dropped." I did not have an alert for "the disk is filling up." So a full disk is a slow, predictable problem that builds over days. But it only reached me as a sudden downstream symptom, after Postgres had already crashed once.
A downstream alert like "results lost" is not a substitute for watching the resource that actually runs out. I added the missing one: a plain host disk-space alert on node_filesystem_avail_bytes, firing at 80% and 90% used, well before anything starts failing. That is the alert that should have caught this on day one.
Key takeaways
- ClickHouse system log tables are unbounded by default and can dwarf your real data. Mine were 11.8 GB against 20 MB of actual data.
system.text_log and system.trace_log are the usual offenders. text_log is off by default, so check whether something enabled it.- Cap them in config:
remove="1" to disable a log, or <ttl> plus <max_size_rows> to bound the ones you keep. Truncate to reclaim space right away.
- It is not just disk. The same logs burn CPU at idle on small servers. Disabling them, plus
asynchronous_metrics_update_period_s = 60, took reporters in ClickHouse issue #60016 from 40 to 70% CPU down to about 1.5%.
- Anything that pulls artifacts on a schedule, Docker images in my case, needs matching cleanup or it becomes a slow disk leak.
- Alert on the cause (disk space), not only the effect (dropped writes). The cause gives you days of warning; the effect gives you minutes.
This happened on Uptimepage, the uptime monitor I run and dogfood.